Apple Inc. Set To Complete Medium-Term Uptrend With Ending/Diagonal Pattern
by WaveTrack International| July 23, 2018 | 5 Comments
Apple Inc. Set To Complete Medium-Term Uptrend With Ending/Diagonal Pattern
Nasdaq 100
The Nasdaq 100 index tracking over the last several months identified February’s advance approaching the completion of a zig zag pattern. That’s a huge danger signal warning that January’s initial corrective decline remains incomplete. In Elliott Wave terms, January/February’s decline is simply the first sequence within a developing three wave expanding flat pattern. February/July’s zig zag advance is ending the second sequence now, with a third declining sequence about to begin with downside targets -19% per cent below the July high.
But there is always an updside to a downside! The good news is that after the expanding flat pattern has ended, as a 4th wave correction, a 5th wave will then develop the next stage of the larger uptrend, targeting higher-highs.
These price sequences have a direct but positive correlation to Apple Inc.’s price development. Interestingly, even though its Elliott Wave pattern is entirely different.
Apple Inc.
Apple Inc. has a component weighting in the Nasdaq 100 of 11.306% per cent. It is indeed a key indicator of the general trend. Just over 2-years ago, on May 24th 2016, we issued a new buy-signal for Apple Inc. as it was just ending an intermediate degree 4th wave retracement at 96.43 having touched a low at 89.47. Since then, the stock has traded up to 194.20, a gain of 101% per cent – see fig #1 – inset, right. But what next?
Apple Inc. – Elliott Wave Forecast 2018
Intermediate wave (5)’s advance from 89.47 has unfolded into a five wave expanding-impulse pattern, i-ii-iii-iv-v. But interestingly, the final advance as minor wave v. five has been identified as unfolding into a five wave diagonal-impulse pattern. Specifically, an ending/contracting-diagonal – see fig #1 – foreground, left.
Apple Inc. and the Elliott Wave Ending Diagonal Pattern
The diagonal has its characteristic wedge-shaped form. It is contracting as it moves towards completion, labelled in minute degree, 1-2-3-4-5. An ‘ending’ type diagonal like this one, where it is ending the larger uptrend as a fifth wave means its impulse waves, 1-3-5 have a tendency to subdivide into zig zags (or multiples). For example [a]-[b]-[c] which is very evident in Apple Inc.’s advances that began the diagonal from the June ’17 low. It is this characteristic that specifically endorses the diagonal, setting itself apart from just about any other pattern in Elliott’s compendium.
This analysis identifies a 3rd wave high as minute wave 3 ending into the June ’18 high of 194.20. However, the 4th wave, minute wave 4 remains incomplete to the downside. The late-June decline to 180.73 was not enough to complete the entirety of wave 4 – more downside is necessary. This 4th wave is labelled as unfolding into a zig zag where the final sequence pulls prices lower from around current levels, targeting 175.80+/-.
Apple Inc. and Fibonacci Price Ratios
This is derived by extending the 180.73 decline by a fib. 38.2% ratio. It tallies with the fib. 38.2% retracement of wave 3 three’s advance. Thus forming a fib-price-ratio convergence-matrix of support at this area. A fib. 61.8% ratio would otherwise extend this 4th wave towards 170.80+/- but a lower downside attempt like this is time-dependent. It will need to decline fairly rapidly so as to maintain the correct angle of the lower boundary-line of the diagonal.
This 4th wave decline correlates to the Nasdaq 100’s expected decline of -19% per cent referred to earlier. The percentages don’t exactly match. Apple Inc. would drop by only -9.4% per cent to 175.80+/- or -12.0% per cent to 170.80+/-, but that simply means it will outperform its peers.
Looking Ahead
Once the 4th waves for the Nasdaq 100 and Apple Inc. are out of the way, a 5th wave advance can begin for both. Apple Inc.’s upside target as minute wave 5 within the diagonal result in gains of +14-18% per cent – impressive!. Definitely, one to keep watching!
Are you trading the SP500, EuroStoxx, Nasdaq100, Russell 2000, Dow Jones 30, Dax, FTSE100, Shanghai Composite, Hang Seng or ASX200? Don’t miss WaveTrack’s regular updates in our bi-weekly EW-Compass Report! Ensure you’re tracking our Forex forecasts – subscribe online for the EW-COMPASS REPORT.
Visit us @ www.wavetrack.com and subsribe to our latest EW-COMPASS report!
Currencies & Interest Rates 2018 Video Release
by WaveTrack International| July 20, 2018 | No Comments

WaveTrack’s New Currencies and Interest Rates Elliott Wave Video has been released!
PART III – CURRENCIES & INTEREST RATES
US$ Dollar 2018 Rebound Set to Continue to Year-End – Long-Dated U.S./European Yields Formed Peak Last May
INCLUDES ANALYSIS ON MAJOR US$ DOLLAR PAIRS/CROSSES – ASIAN/EM CURRENCIES – MEDIUM-TERM CYCLES – LONG-DATED YIELDS US/EUROPE/JAPAN + SPREADS
We’re pleased to announce the publication of WaveTrack’s mid-year 2018 video updates of medium-term ELLIOTT WAVE price-forecasts. Today’s release is PART III, CURRENCIES & INTEREST RATES – Parts I & II were released during the last month – please contact us for information.
• PART I – STOCK INDICES – out now!
• PART II – COMMODITIES – out now!
• PART III – CURRENCIES & INTEREST RATES – out now!
January’s Forecasts for 2018 – CURRENCIES REVIEW
The Annual 2018 CURRENCIES & INTEREST RATES report commented ‘…Despite consensus opinion that the dollar will continue to trend lower during the coming year, the completion of a five wave impulse decline will in contrast, open the way for a multi-month corrective bounce to unfold. Analysis projects a fib. 50% retracement towards 95.42+/- over the next several months…’.
The problem with contrarian forecasts is that it’s so binary – either right or wrong which in terms of probability, is insufficient in itself because it comes wrapped in human pre-conception. But when applied with the predictive laws inherent in the Elliott Wave Principle, it becomes a powerful ally. The US$ dollar index ended that five wave impulse downtrend into February’s low of 88.26 – it has since traded higher to 95.52!
The same theme of a US$ dollar directional change was also translated across all the other major dollar pairs. But when it came to dealing with a strengthening US$ dollar through 2018, trouble was brewing for Emerging Market/Commodity related currencies. Last January’s report noted ‘…Emerging Market currencies, particularly those traded within the Asian ADXY index are trending higher from the Dec.’16 lows but again, will undergo a weakening period lasting several months before the medium-term uptrend resumes…’.
How did these Elliott Wave price-forecasts pan out?
As we already know, the benchmark US$ dollar index ended its five wave impulse decline into last February’s low at 88.26 and yes, it has subsequently traded up to targets of 95.42+/- with amazing accuracy. The Euro/US$ was forecast ending its equivalent five wave upswing from last year’s low, then staging a counter-trend decline – the Euro/US$ has since traded down from 1.2556 to 1.1509, a decline of -8.3% per cent. Naturally, if such large currency movements are forecast correctly, then there’s a pretty good chance of anticipating the right direction and amplitude for many other US$ dollar pairs and crosses.
But one of the stand-out forecasts for 2018 was the realisation that a strengthening US$ dollar would cause severe declines for the Emerging Market and Commodity-based currencies.
Currencies like the Brazilian Real have seen the weakest response to a strengthening US$ dollar, partly because of political upheaval but because of a commodity price meltdown.
In Asia, the ADXY Asian Dollar index was forecast last January to begin a sharp counter-trend decline from the 112.20 level – this was expected because the US$ dollar index was due to begin an upside recovery. And sure enough, the index has since declined by -5.4% per cent but is now levelling off.
China’s Renminbi was forecast to end a corrective decline towards 6.1050+/- then resume its larger uptrend. We couldn’t know why such a large upswing for the US$/CNY would unfold basis fundamentals but it later became obvious when the exchange rate ended at 6.2432 then flipped up to 6.6800 early-July as President Trump’s trade war entered the retaliation phase with China.
There were many more forecasts from January’s report that hinged upon a return to US$ dollar strength, but these are just a few examples – many others followed the same theme.
January’s Forecasts for 2018 – INTEREST RATES REVIEW
The Annual 2018 CURRENCIES & INTEREST RATES report commented ‘…The July ’16 troughs in U.S. and European yields represent the beginning of the next 30-35-year uptrend cycle. The recent break for the US10yr treasury yield above the 2017…indicates further upside potential into the end of Q1 ’18, beginning of Q2 targeting 3.360+/-…Once completed, a multi-month corrective decline would then begin, pulling yields sharply lower…The US10yr TIPS Breakeven Inflation Rate Spread indicates an interim peak forming at the same time as treasury yields…This suggests worries over the reemergence of inflationary pressures will abate for a while…In Europe, the European Central Banks relaxed approach to inflation means it remains with its existing QE programme…’.
How did these Elliott Wave price-forecasts pan out?
US10yr treasury yields began the year at 2.461% with upside targets towards 3.360+/- to complete the five wave uptrend that began from the July ’16 low of 1.316%. The actual peak came up slightly short though, ending at 3.127% into May’s high – it then declined rapidly to 2.748% later that month.
The US10yr TIPS Breakeven Inflation Rate Spread began the year trading at 2.075% with upside targets of 2.177%. It traded up to 2.182% last April and has since edged lower at 2.097% to begin a multi-month correction.
In Europe, the benchmark DE10yr yield has also ended a multi-year five wave uptrend that began from the July ’16 lows into February’s high of 0.806%. It has since declined rapidly as part of a multi-month correction to 0.182. The ECB has continued its easy monetary policies despite pressure from Germany’s Bundesbank to begin a tightening phase.
What Next H2 2018?
In this latest mid-year PART III 2018 video, the CURRENCIES section has been expanded upon to include several new currency crosses in addition to the major G8 currency pairs. Medium-term cycles are updated along with the very latest COT Aggregated Position Reports for the US$ Dollar, Euro, British Pound/Sterling, Yen, Aussie Dollar, and Canadian Dollar. The video begins by reviewing the 15.6-year and 7.8-year US$ dollar cycles, their current location and trend, how they correspond to the medium-term Elliott Wave counts. The same analysis is conducted for the Euro/US$ before updating price-forecasts and Fibonacci-Price-Ratio targets for the remaining G8 currencies.
Analysis then moves through the Euro-crosses, British Pound/Sterling crosses, before reaching the final segment of Asian/Emerging Market Currencies against the US$ dollar. There is also a weekly time-series forecast for Bitcoin!
A total of 47 currency charts.
The INTEREST RATES section begins with analysis of the long-term cycle with data on the 30yr yield dating back to the year 1760’s (250+ years!).
An overlay of the US30yr yield is added with Elliott Wave counts illustrating the previous Inflation-Peak cycle and the following Deflationary era ending in 2016.
EW analysis continues with the US10yr, US05yr and US02yr yields, comparison studies revealing the next major yield trends. The U.S. 10-year INFLATION TIPS is updated which is really important because of the recent rise in inflationary pressures.
Moving on to Europe, we examine the impact of the continuing easy-monetary policies of the European Central Bank with the DE10yr yield, its trend and whether it will still be used as a safe-harbour in the event of a new Italian political crisis. In fact, we add the Elliott Wave analysis for the ITY10yr yield before concluding with a look at the long-term Japanese JPY10yr yield with data that begins from the year-1930’s onwards!
A total of 18 interest rates charts
This new mid-year 2018 CURRENCIES & INTEREST RATES video is like nothing you’ve seen anywhere else in the world – it’s unique to WaveTrack International, how we foresee trends developing through the lens of Elliott Wave Principle (EWP) and how its forecasts correlate with Cycles and other asset classes from around the world.
We invite you to take this next part of our financial journey with us – video subscription details are below – just follow the links and we’ll see you soon!
Most sincerely,
Peter Goodburn
Founder and Chief Elliott Wave Analyst
WaveTrack International
The contents of this CURRENCIES & INTEREST RATES VIDEO include Elliott Wave analysis for over 65 charts explained during this in-depth video broadcast over 2 hours:
Currencies (47 charts):
• US$ Index + Cycles
• Euro/US$ + Cycles
• Stlg/US$
• US$/Yen
• AUD/US$
• NZD/US$
• AUD/NZD
• US$/CAD
• Euro/Stlg
• Euro/CHF
• Euro/Yen
• Asian ADXY
• US$/IDR
• US$/MXN
• US$/ZAR
• Stlg/YEN
• Stlg/ZAR
• Stlg/AUD
• US$/BRL
• US$/RUB
• US$/PLZ
• US$/CNY
• Bitcoin
Interest Rates (18 charts):
• US30yr Yield + Cycles
• US10yr Yield
• US5yr Yield
• US2yr Yield
• US10yr TIPS Break Even Inflation Rate
• DE10yr Yield + Spreads
• ITY10yr Yield
• JPY10yr Yield
CONTACT US NOW VIA EMAIL – SELECT YOUR PACKAGE
Single Video – *$48.00 – PART III CURRENCIES + INTEREST RATES VIDEO (July 2018)
Triple Package offer – *$96.00 (saving 33%)! – PART I – PART II – PART III (June/July 2018)
*(additional VAT may be added depending on your country – currently US, Canada, Asia have no added VAT but most European countries do)
PART III will be available in a few weeks’ time (2018!) – we’re working on it!
HOW TO PURCHASE THE VIDEO FORECAST?
To receive your VIDEO UPDATE please click here to contact us.
– Please state if you wish to purchase the SINGLE VIDEO for CURRENCIES + INTEREST RATES for USD *48.00?
– Or opt for the TRIPLE PACKAGE for USD *96.00 in total?
– Next we will send you a PayPal payment request and provide you with the video link & PDF report once confirmed.
*(additional VAT may be added depending on your country or residence. Currently, the US, Canada, Asia have no added VAT but most European countries do)
Visit us @ www.wavetrack.com
NIFTY 50 BREAKS HIGHER – BUT PART OF EXPANDING FLAT
by WaveTrack International| July 11, 2018 | 5 Comments
• The Nifty 50 has just broken above the May high. However, it is unfolding ina ann expanding flat from 10957.00 as minute wave 2. This allows a -8.6% decline during next couple of months
The Nifty 50 has broken above the May high of 10957.00 which negates declines to 9795.00+/- as the continuation of January’s zig zag corrective downswing. This revised count relabels the correction as ending last March at 9903.00 as minor wave iv. four within the Feb.’16 impulse uptrend as part of intermediate wave (5).

India Nifty 50 – Elliott Wave Price Forecasting Update by WaveTrack International
Minor wave v. five begins with minute wave 1 ending into the May high at 10957.00. Yet, wave 2 is most likely unfolding into an expanding flat – see fig #1. This requires a more immediate upside test towards 11175.00+/-. But afterwards expect a decline to 10282.00-205.00+/- before completion and a resumption of the larger uptrend.
Regular updates for India’s Nifty 50 are available via WaveTrack’s bi-weekly Elliott Wave Compass report – click here
And in our latest Mid-Year Stock Indices Video – click here and see below.
CONTACT US NOW VIA EMAIL – SELECT YOUR PACKAGE
Single Video – *$48.00 – PART I STOCK INDICES (June/July 2018)
Triple Package offer – *$96.00 (saving 33%)! – PART I – PART II – PART III (June/July 2018)
*(additional VAT may be added depending on your country – currently US, Canada, Asia have no added VAT but most European countries do)
PARTS II & III will be available in a few weeks’ time (2018!) – we’re working on it!
HOW CAN YOU RECEIVE THE VIDEO FORECAST?
To receive your VIDEO UPDATE please click here to contact us.
– Please state if you wish to purchase the SINGLE VIDEO for STOCK INDICES for USD *48.00?
– Or opt for the TRIPLE PACKAGE for USD *96.00 in total?
– Next we will send you a PayPal payment request and provide you with the video link & PDF report once confirmed.
*(additional VAT may be added depending on your country or residence. Currently, the US, Canada, Asia have no added VAT but most European countries do)
We’re sure you’ll reap the benefits – don’t forget to contact us with any Elliott Wave questions – Peter is always keen to hear you views, queries and comments.
Most sincerely,
WaveTrack’s Elliott Wave Team
Visit us @ www.wavetrack.com
Commodities Video 2018 Mid-Year Update!
by WaveTrack International| July 4, 2018 | 2 Comments
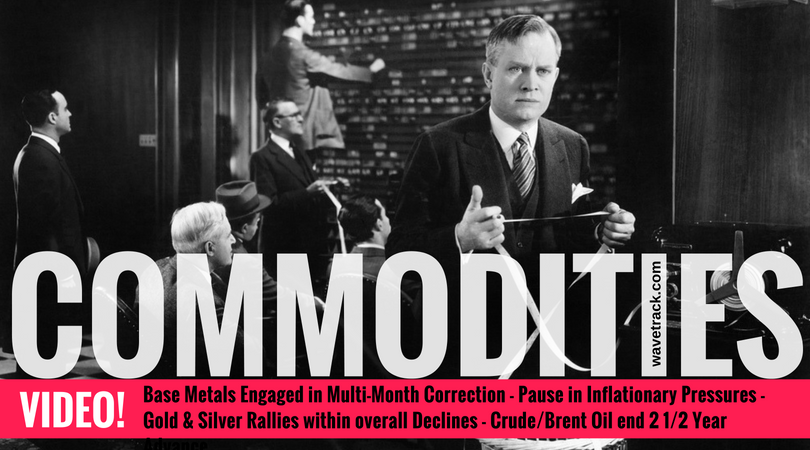
In this COMMODITIES VIDEO you find out why Base Metals Engaged in Multi-Month 2nd Wave Correction – Why there is a Pause in Inflationary Pressures – Why there will be Gold & Silver Rallies within overall Declines – and Why Crude/Brent Oil end 2 1/2 Year Advance!
We’re pleased to announce the publication of WaveTrack’s mid-year 2018 video updates of medium-term ELLIOTT WAVE price-forecasts. Today’s release is PART II, COMMODITIES – Part I was released last month and Part III will be published later this month, in July.
• PART I – STOCK INDICES – out now!
• PART II – COMMODITIES – out now!
• PART III – CURRENCIES & INTEREST RATES – coming soon!
January’s Forecasts for 2018 – REVIEW
In January’s Annual 2018 EW-Forecast Commodities Video, several key commodity events were highlighted –
• Base metals – were identified as ending their 1st wave upswing within the 2nd Phase of the ‘INFLATION-POP’ uptrend that began from the Feb.’16 lows. January’s report forecasted a hefty 2nd wave correction unfolding through 2018
• Precious Metals – gold was bullish at the beginning of the year when prices were just edging higher, above the late-December ’17 low of 1236.44 – the next cycle peak was forecast in June ’18 – silver was bullish too, but there were downside risks in the equity miners – GDX was forecast to dip to 19.30+/- and XAU to 63.85+/-
• Crude oil cycles were still moving higher last January but they were next due to form a peak in August ’18 – meanwhile, crude oil was trading at 60.39 but was forecast up to 78.90+/- perhaps even 88.80+/-. Brent oil was trading at 66.92 with upside forecasts to 77.22+/-, max. 93.80+/-. The benchmark XLE Energy (equity) ETF/index was trading at 72.87 and set to resume its intermediate-term uptrend
How did these Elliott Wave price-forecasts pan out?
The first 6-months has seen some amazing price moves, especially given the accompanying event-driven background of geopolitics and trade-tariff disputes triggered by U.S. President Trump. One immediate impact of U.S. foreign policy was to slap Russian oligarchs with more sanctions. Now, this briefly sent a couple of BASE METALS soaring higher but then collapse shortly afterwards. Others that weren’t affected formed synchronous peaks that ended 1st wave uptrends within the ‘inflation-pop’ schematic – and right on schedule! Aluminium and Nickel, two metals that were listed on the Russian oligarch list formed peaks in April whilst others like Lead and Zinc formed corresponding higher earlier, in February – Copper in June. As a result forecasts for a ‘hefty’ 2nd wave correction are already underway with Copper down -11%, Zinc -21%, Aluminium -22% per cent.
Gold & Silver Rallies within overall Declines
PRECIOUS METALS began the year in-line with bullish forecasts. However, by late-January/early-February, when the US$ dollar was seen ending its five wave impulse downtrend that began from the January ’17 peak, it became more obvious that precious metals would stall with the next major uptrend. Only being interrupted by a temporary multi-month US$ dollar strengthening period. Despite rising inflationary expectations at the time, a contrarian bearish forecast for gold was updated to show prices being capped amidst a dollar upside correction. Silver was also set to prolong its corrective decline that began from the Aug.’16 peak. Platinum would also remain under pressure but its long-term outperformance switch remained in focus.
Crude/Brent Oil end 2 1/2 Year Advance
CRUDE and BRENT OIL formed the charge higher into the first 6-month period of 2018. Most noteworthy they remain the outperforming commodities for the year. Crude oil is up by +23% per cent and Brent oil is higher by +20% per cent. OPEC’s decision earlier in the year to limit production has had a huge impact to the point where global stocks are at historically low levels. There are hints to increase production from the Saudi’s and perhaps Russia but this is opposed by Iran. But overall, Elliott Wave forecasts have performed perfectly into mid-year but prices are now approaching those all-important upside targets – how will they develop for the remainder of this year?
The Next 6-Months
One of the themes that was forecast in last January’s video series was the impact of the US$ dollar’s inevitable turn-around. Its 2017 five wave impulse decline was coming to an end, completing the 1st wave within its 7.8-year downtrend cycle. But a 2nd wave would usher in a period of multi-month strength which would then pull Emerging Markets lower and Commodities too.
The US$ dollar has certainly strengthened from February’s low into June’s high, but this is only part of its 2nd wave correction – there’s more to come once a shorter-term downswing has ended. That means more downside pressure for Commodities throughout the remaining period of 2018.
New Commodities Video Mid-Year Update – PART II/III
This latest mid-year 2018 video update of Elliott Wave Commodity prices takes a look through each sector, BASE METALS – PRECIOUS METALS – ENERGY and determines price trends and key reversal-signature levels for the next several months. These are not arbitrary price-points or randomly chosen Elliott Wave counts – they are compiled with PRECISION & ACCURACY applying WaveTrack International’s unique combination of Pattern-Recognition and Fibonacci-Price-Ratios.
This new mid-year 2018 COMMODITIES video is like nothing you’ve seen anywhere else in the world – it’s unique to WaveTrack International, how we foresee trends developing through the lens of Elliott Wave Principle (EWP) and how its forecasts correlate with Cycles and major contracts of other asset classes from around the world.
We invite you to take this next part of our financial journey with us – video subscription details are below – just follow the links and we’ll see you soon!
Most sincerely,
Peter Goodburn
Founder and Chief Elliott Wave Analyst
WaveTrack International
Contents: 69 charts | Lenght: 2 hours
• US$ Cycle
• CRB-Cash index + Cycles
• Copper + Cycles + Correlation Studies
• Aluminium
• Lead
• Zinc
• Nickel
• Tin
• Iron-Ore + Correlation
• XME Metals & Mining Index
• BHP-Billiton
• Freeport McMoran
• Antofagasta
• Anglo American
• Kazakhmys Copper
• Gold + Cycles
• GDX Gold Miners Index
• Newmont Mining
• GoldCorp Inc.
• Amer Barrick Gold
• Agnico Eagle Mines
• AngloGold
• Silver
• Silver Correlations
• XAU Gold/Silver Index
• Gold/silver Ratio
• Palladium Correlations
• Palladium
• Platinum Correlations
• Platinum
• Crude Oil + Cycles
• Brent Oil
• XLE Energy SPDR Index
How to Subscribe?
CONTACT US NOW VIA EMAIL – SELECT YOUR PACKAGE
Single Video – *$48.00 – PART II COMMODITIES VIDEO (July 2018)
Triple Package offer – *$96.00 (saving 33%)! – PART I – PART II – PART III (June/July 2018)
*(additional VAT may be added depending on your country – currently US, Canada, Asia have no added VAT but most European countries do)
PART III will be available in a few weeks’ time (2018!) – we’re working on it!
HOW CAN YOU RECEIVE THE VIDEO FORECAST?
To receive your VIDEO UPDATE please click here to contact us.
– Please state if you wish to purchase the SINGLE VIDEO for COMMODITIES for USD *48.00?
– Or opt for the TRIPLE PACKAGE for USD *96.00 in total?
– Next we will send you a PayPal payment request and provide you with the video link & PDF report once confirmed.
*(additional VAT may be added depending on your country or residence. Currently, the US, Canada, Asia have no added VAT but most European countries do)
Visit us @ www.wavetrack.com
ELLIOTT WAVE Half Moon Pattern
by WaveTrack International| July 2, 2018 | 8 Comments
Half Moon Pattern – TWITTER question dated 30th June 2018:
Q. Great work! I have a question in which I hope you can answer. Elliot mentioned a phenomena in the market called the Half Moon. Was this a pattern and is this valid under the wave principle according to your opinion?
R.N. Elliott – The Wave Principle – page 30, paragraph 2, Half Moon
RARITIES IN THE 1937-1938 BEAR MARKET
The 1937-1938 Bear Market provided a number of Novelties, for example:
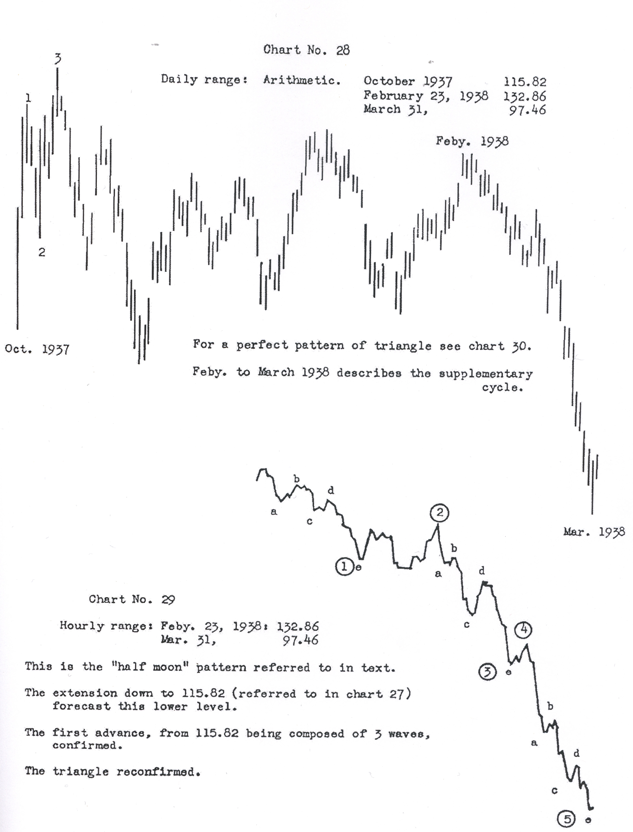
Half Moon Elliott Wave History: This is the name given to the pattern which developed between February 23rd and March 31st 1938, 132.00 to 98.00. It curved downward and at bottom almost perpendicular – just like a ‘half moon’. The same pattern occurred in April 1936, 163.00 to 141.00. Both were retracements of extensions. On account of the high speed, it is necessary to recur [sic, refer] to the hourly record, especially during the latter half. See Chart 29.
Peter Goodburn’s Half Moon Answer:
R.N. Elliott’s discoveries were a work in progress – given time, access to more historical data and the use of software that can measure Fib-Price-Ratios, I’m sure some of his notes would be amended in later revisions.
As for the – Half Moon – pattern (see ‘The Wave Principle’ – 1938) Elliott noted the especially the speed of the decline from the February 23rd 1938 high of 132.86 into the low of March 31st at 97.46. He indicated the velocity and trajectory of this decline was like a – half moon. Mainly, because the curvature of the acceleration into the low was almost perpendicular (inverse/vertical). He explained this was the case because the 5th wave within this impulse decline was the ‘extended’ wave sequence of the three impulse sequences. For example the largest of waves 1 3 5 – see fig #1 (charts #28 & #29 – The Wave Principle – R.N. Elliott – pages 30 & 47). See fig #1 in this article.
R.N. Elliott’s original Half Moon Pattern Example
He continued to make distinctions between the perpendicular decline of the February/March 1938 decline and the pattern during the Great Depression collapse of 1929-32. And yes, there are significant pattern differences in the way these two declines. But that is not the important issue.
Half Moon – The bigger question is whether 5th wave extensions always advance or decline in vertical/perpendicular characteristics?
We tend to think not because the 1974 advance is a cycle degree 5th wave extension and yet it shows no sign of an exponential or perpendicular rise (at least not so far!). This must be viewed with a perspective from the 1932 low. But we do acknowledge that this phenomenon is more likely to be seen in the wave ‘C’ location of a zig zag downswing when labelled as a 2nd wave. We’ve documented many situations when the ‘C’ wave slides lower in such a manner that it no longer measures in proportionality with the ‘A’ wave that preceded it. In this case it is much larger by comparison whilst its five wave subdivision often contains an ‘invisible’ 4th wave and sometimes a 5th wave ‘extension’.
WaveTrack’s Half Moon Observations
Peter Goodburn’s Dow Jones Half Moon Pattern Example
Let’s take another look at R.N. Elliott’s example of the – Half Moon – impulse decline. Can you see that it was actually the larger 5th wave, i.e. intermediate wave (5) within an impulse decline that began from the April ’37 peak of 195.50 labelled primary wave A? See fig #2. Wave (5) declined following the completion of a contracting/symmetrical-triangle pattern that unfolded in wave (4). Elliott’s observations concluded that a break-out following a triangle is severe and accelerative. And this is exactly what happened for wave (5)! It seems to us that wave (5) needn’t have contained a fifth wave extension because its trajectory and speed of decline was dictated by the triangle that preceded it. The fact that it did contain a fifth wave extension in its subdivision was, however, a contributing factor of the perpendicular way it ended the decline which resulted in Elliott’s Half Moon terminology.
STOCK INDICES VIDEO Update! TERMINAL 3rd WAVE IN FOCUS FOR REMAINDER OF 2018!
by WaveTrack International| June 23, 2018 | 2 Comments

WaveTrack’s latest Elliott Wave Video has been released!
U.S. Indices Poised for Dive! – EM Bounce on Dollar Correction – Asia Looking Inexpensive!
STOCK INDICES – Part I
Includes Updated SENTIMENT & ECONOMIC INDICATOR STUDIES
Stock Indices – TERMINAL 3rd WAVE IN FOCUS FOR REMAINDER OF 2018!
We’re pleased to announce the publication of WaveTrack’s mid-year 2018 video updates of medium-term ELLIOTT WAVE price-forecasts. Today’s release is PART I, STOCK INDICES – Parts II & III will be published during the next month.
• PART I – STOCK INDICES
• PART II – COMMODITIES
• PART III – CURRENCIES & INTEREST RATES
Stock Indices Forecasts December ’17 for 2018
The Annual 2018 report published last December highlighted several main points – the secular-bull uptrend remained in upward progress and contrary to consensus Elliott Wave and Economists’ opinion, was on course to continue higher over the next 18-month/2-year period – the post-financial-crisis uptrend was approaching its terminal 3rd wave peak but would undergo a severe -7% per cent correction into January before resuming the last phase of its impulse sequence – Emerging Markets were set to continue their outperformance role but they too would undergo some significant retracement which leads the major indices lower in a period of underperformance – however, their ‘inflation-pop’ uptrends are strong and will recover afterwards. The banking sector was expected to underperform during the same period. Chinese indices were forecast approaching an interim peak having advanced over the last 2-year period – then stage a severe correction along with other EM’s.
EW-Forecast Review – H1 2018
Reflecting back to last December’s forecasts, we can report that most of the forecasts were realised within acceptable tolerance – the secular-bull uptrend has remained on course, the 3rd wave of the post-financial-crisis impulse uptrend has moved closer towards a terminal high but remains incomplete – January did see an interim sell-off, but larger than our -7% per cent estimate with the benchmark S&P 500 dropping -11.8% per cent – this wasn’t the end of the secular-bull uptrend as consensus reports led us to believe with outperforming indices since trading to new record highs – Emerging Markets have underperformed with the benchmark MSCI EM index falling -13.0% per cent so far this year – the U.S. KBW Banking index has been down from its January peak by -12.2% per cent, underperforming the S&P by -8.0% percentage points whilst in Europe, the Eurostoxx Banks index is down from its January peak by a massive -23.8% per cent. China’s Shanghai Composite is down by -19.8% per cent.
What Next H2 2018? – U.S. Benchmark Indices
There’s a lot of bearish divergence in U.S. stock indices which alerts us to another up-coming downswing, extending the counter-trend corrective pattern that began declines from last January’s 2018 highs.
U.S. trade tariff policies are taking their toll and in this latest MID-YEAR 2018 VIDEO UPDATE, we’re examining the current location of not only U.S. indices but how the pattern progress has unfolded for key EUROPEAN & ASIAN indices too. Will the current tariff plans explode into a full-blown trade war? Is such a possibility evident in the Elliott Wave charts? This video has the answers.
European Indices
Key European indices formed important highs last November (2017) which created bearish divergences when U.S. indices formed subsequent highs last January. Since then, overall declines are identified as corrective, counter-trend sequences within five wave impulse uptrends in progress from the Feb.’16 lows. BUT HOW FAR CAN THESE DECLINES UNFOLD? WE INTEND TO FIND OUT!
Emerging Markets + Asia – Australia – Japan
Emerging Markets along with many benchmark commodity markets are unfolding into the ‘INFLATION-POP’ schematic first postulated in these reports back in year-2010. From an Elliott Wave perspective, the inflation-pop represents the second sequence of a multi-decennial expanding flat counter-trend pattern that is unfolding from the 2007/08 peaks that ended super-cycle uptrends. In this latest mid-year video, we take a look across EM’s, ASIA, Australia and Japan and answer why EM’s have been particularly hard hit this year and what to expect for the remainder of 2018.
New Stock Index 2018 Video – PART I/III
This MID-YEAR 2018 VIDEO UPDATE for STOCK INDICES is like nothing you’ve seen anywhere else in the world – it’s unique to WaveTrack International, how we foresee trends developing through the lens of Elliott Wave Principle (EWP) and how its forecasts correlate with Cycles, Sentiment extremes and Economic data trends.
We invite you to take this next part of our financial journey with us – video subscription details are below – just follow the links and we’ll see you soon!
Most sincerely,
Peter Goodburn
Founder and Chief Elliott Wave Analyst
WaveTrack International
How to Subscribe:
Contents: 70 charts
• Copper
• S&P 500 + Cycles
• Nasdaq 100
• Dow Jones 30
• VIX Volatility Index
• NYSE Advance-Decline
• AAII Bullish Sentiment
• Consumer Sentiment
• Consumer Confidence
• US GDP data
• S&P Price/Book Ratio
• S&P Price/Sales Ratio
• S&P CAPE P/E Ratio
• Bank of America/Merrill Lynch FMS Survey
• Russell 2000
• S&P 400 Mid Cap Index
• KBW Banking Index
• XLK Technology
• Nasdaq Biotechnology
• XLF Financial
• XLP Consumer Staples
• XLY Consumer Discretionary
• Eurostoxx 50
• Xetra Dax 30
• FTSE-100
• MSCI Emerging Market
• MSCI BRIC
• Bovespa
• Russia RTS
• Nifty 50
• Sensex BSE India
• MSCI China
• Shanghai Composite
• China Enterprises
• MSCI Hong Kong
• Hang Seng
• Taiwan SE Weighted
• Singapore Straits
• ASX 200
• Nikkei 225
CONTACT US NOW VIA EMAIL – SELECT YOUR PACKAGE
Single Video – *$48.00 – PART I STOCK INDICES (June/July 2018)
Triple Package offer – *$96.00 (saving 33%)! – PART I – PART II – PART III (June/July 2018)
*(additional VAT may be added depending on your country – currently US, Canada, Asia have no added VAT but most European countries do)
PARTS II & III will be available in a few weeks’ time (2018!) – we’re working on it!
HOW CAN YOU RECEIVE THE VIDEO FORECAST?
To receive your VIDEO UPDATE please click here to contact us.
– Please state if you wish to purchase the SINGLE VIDEO for STOCK INDICES for USD *48.00?
– Or opt for the TRIPLE PACKAGE for USD *96.00 in total?
– Next we will send you a PayPal payment request and provide you with the video link & PDF report once confirmed.
*(additional VAT may be added depending on your country or residence. Currently, the US, Canada, Asia have no added VAT but most European countries do)
We’re sure you’ll reap the benefits – don’t forget to contact us with any Elliott Wave questions – Peter is always keen to hear you views, queries and comments.
Most sincerely,
WaveTrack’s Elliott Wave Team
Visit us @ www.wavetrack.com
Eurostoxx Banks Index – Banks Set For Another Swift Decline
by WaveTrack International| June 14, 2018 | No Comments
Counter-Trend Rally Completed – Banks Set For Another Swift Decline
The late-May counter-trend rally from 109.30 is completing now to 115.91, max. 116.91+/-. The index is poised to resume its five wave impulse downtrend that began from April’s high of 131.98. 5th wave downside targets to complete primary wave A are towards 106.56-103.15+/-.
Winding the clock back to end-April when price levels were trading at 129.64. At the time downside forecasts for the Eurostoxx Banks index were measured towards 112.15+/-. Since then, prices have accelerated lower as a five wave impulse pattern that originated from the April high of 131.98, but this remains incomplete – see fig #1.
EuroStoxx Banks – 60 mins. – Elliott Wave forecast by WaveTrack International
This is primary wave A subdividing into an intermediate degree ‘expanding-impulse’ pattern, (1)-(2)-(3)-(4)-(5). At the very least, wave (3) ended into the late-May low of 109.30 with wave (4) approaching completion at 115.91. Or perhaps extending just a little higher to 116.91+/-. The downside risk-skew is evident. Downside targets for wave (5) vary, at either 106.56+/- or max. 103.15+/-. The higher number is derived by extending the origin of this impulse pattern, from 131.98 to the point which began ‘price-expansion’ at 121.62 by a fib. 161.8% ratio. The lower is simply where wave (5) unfolds by a fib. 61.8% correlative ratio of waves (1)-(3).
Conclusion
There is certainly some short-term downside risk over the next few weeks basis June’s counter-trend rally coming to an end now. That will ensure a break below the late-May low of 109.30 towards 106.56+/-, max. 103.15+/-, a decline of min. -6.5% per cent, max. -11.75+/-. But further out, it seems the Eurostoxx Banks index will seek even lower numbers sometime towards year-end before completing this year’s correction.
India Nifty 50 – Set to Begin Declines
by WaveTrack International| June 11, 2018 | 2 Comments
India-CNX Nifty 50 – January’s Zig Zag Pattern Set to Begin Wave [c] Declines
January’s decline began a zig zag correction from 11191.00 as minute wave 4. Subdividing into an [a]-[b]-[c] pattern. First of all wave [a] completed an initial decline into the February low of 10250.00. Wave [b] has since unfolded higher as an expanding flat pattern, (a)-(b)-(c), 3-3-5 ending into the mid-May high of 10957.00. Wave [c] declines are now in the early stages of accelerating lower. Ultimate targets to 9795.00+/-.

Nifty 50 – Elliott Wave Price Forecast by WaveTrack International
Nifty 50 – [wave [c] description so far]
Short-term upside targets to complete sub-minuette wave (ii) towards 10855.00+/- were hit into last Thursday’s trading session at 10857.00. The following decline to 10692.50 has now begun wave (iii) declines. These declines can be expected to accelerate lower during the coming week. Downside targets for wave (iii) are towards the March lows of 10057.00+/- and 9895.00+/-. Wave (v) downside targets remain unchanged towards 9795.00+/-. This also ends wave [c] of the zig zag pattern that began this correction from January’s high of 11191.00.
Nifty 50 – Fibonacci Price Ratios for alternate lower targets
However, take note that India’s Nifty 50 could still hit lower targets. The following Fibonacci Price Ratios can be used as a pointer. The 9795.00+/- level is the fib. 38.2% ret. of minute wave 3’s advance from 7896.00. However, a lower target is derived if wave [a] including the March lower-low is extended by a fib. 38.2% ratio to 9451.00+/-. Even, slightly higher targets should be considered at 9708.00+/- if wave [a] to its orthodox low at 10250.00 is extended by a fib. 61.8% ratio.
Are you trading the Nifty 50, SP 500, EuroStoxx, Nasdaq 100, Russell 2000, Dow Jones 30, Dax, FTSE100 or ASX200? Don’t miss WaveTrack’s regular updates in our bi-weekly EW-Compass Report! Ensure you’re tracking our Forex forecasts – subscribe online for the EW-COMPASS REPORT.
Visit us @ www.wavetrack.com and subsribe to our latest EW-COMPASS report!
EuroStoxx June Rally Finds Secondary Support!
by WaveTrack International| June 8, 2018 | 4 Comments
EuroStoxx and Xetra Dax – June Rally Finds Secondary Support! [title for twitter]
The May corrective zig zag declines for both the Eurostoxx 50 and Xetra Dax remain incomplete targeting 3315.75+/- and 12145.00+/- respectively, but the interim June rally labelled wave ‘b’ hit important support levels this morning, slightly above last week’s low which now has the ability of stretching wave ‘b’ higher towards 3529.00+/- and 12992.00+/- prior to wave ‘c’ declines.
European Indices
European indices were marked lower overnight and into Friday’s trading session but this week’s decline has been identified as ending a corrective three wave zig zag pattern from 3497.32 (EuroStoxx 50, see left) and from 12925.00 (Xetra Dax, see right). This means another push higher can begin from Friday morning’s lows, prolonging wave ‘b’ rallies to higher levels.

EuroStoxx – Xetra Dax – Elliott Wave Forecast by www.wavetrack.com
An equality ratio, i.e. fib. 100% of the late-May/early-June upswing added to Friday morning’s lows projects wave ‘b’ upside targets towards 3529.00+/- and 12992.00+/-. This would still allow wave ‘c’ declines to resume afterwards, to original downside targets of 3315.75+/- and 12145.00+/- which then completes the larger zig zag decline that began from May’s highs.
Conclusion
Some interim rallies from the end-May lows are extending higher as wave ‘b’ and this conforms to the U.S. stock index rhythm we also track in the Nasdaq 100 – the Nasdaq 100 is poised to overturn Thursday/Friday’s downswing because this is simply a 4th wave approaching completion within the five wave impulse upswing that began from May 23rd low – watch for support at 7046.00 (Nasdaq 100 futures).
Are you trading the SPX 500, EuroStoxx, Nasdaq 100, Russell 2000, Dow Jones 30, Dax, FTSE100 or ASX200? Don’t miss WaveTrack’s regular updates in our bi-weekly EW-Compass Report! Ensure you’re tracking our Forex forecasts – subscribe online for the EW-COMPASS REPORT.
Visit us @ www.wavetrack.com and subsribe to our latest EW-COMPASS report!
SP500 EuroStoxx Dax – Upside Levels Are Being Tested Now
by WaveTrack International| June 4, 2018 | 1 Comment
SP500 – Interim Upside Resistance Levels Are Being Tested Now!
Overall uptrends that began from the late-March/early-April lows remain on-course. However, shorter-term, interim upside resistance levels are being tested for the S&P 500, Eurostoxx 50 and Xetra Dax indices. These resistance levels were quoted in last Friday’s detailed report. Nevertheless, there is an increasing risk that price-rejection will confirm a temporary retracement decline unfolding over the next week or two.
SP500 – Elliott Wave Forecast by WaveTrack International
The reason for this is because the SP500 has so far, unfolded higher from the recent low of 2675.00 as a three wave zig zag to current levels of 2744.25 – see fig #1. This means it is prolonging wave < b > as either a running flat or a triangle pattern. This would allow a decline from between 2744.25-2751.00+/- to test downside levels towards 2690.00-85.00+/- before the larger uptrend resumes as wave < c >.
EuroStoxx 50 and Dax 30 – Fibonacci Trading Forecast by www.wavetrack.com
A short-term downswing for the SP500 would corroborate last Friday’s forecast for another downswing for the Eurostoxx 50 and Xetra Dax indices – see fig #2. The mid-May peaks ended 1st waves within prevailing uptrends – the following declines have since begun a three wave zig zag corrective pattern for 2nd waves, a-b-c labelled in minor degree for the Eurostoxx 50 (see left) and in minuette degree for the Xetra Dax (see right). Both have completed upside targets for wave ‘b’ today, opening downside risk for wave ‘c’ declines – towards 3315.75+/- for the Eurostoxx 50 and 12145.00+/- for the Xetra Dax.
Conclusion
Larger uptrends remain bullish but this short-term analysis indicates a temporary pause, a corrective downswing prior to a resumption higher later.
Are you trading the SPX 500, EuroStoxx, Nasdaq 100, Russell 2000, Dow Jones 30, Dax, FTSE100 or ASX200? Don’t miss WaveTrack’s regular updates in our bi-weekly EW-Compass Report! Ensure you’re tracking our Forex forecasts – subscribe online for the EW-COMPASS REPORT.
Visit us @ www.wavetrack.com and subsribe to our latest EW-COMPASS report!
« go back — keep looking »
Recent Posts
Recent Comments
Archives
- February 2026
- December 2025
- August 2025
- July 2025
- June 2025
- March 2025
- February 2025
- January 2025
- December 2024
- August 2024
- July 2024
- June 2024
- May 2024
- April 2024
- February 2024
- January 2024
- December 2023
- August 2023
- July 2023
- June 2023
- March 2023
- February 2023
- January 2023
- December 2022
- November 2022
- October 2022
- August 2022
- July 2022
- June 2022
- May 2022
- March 2022
- February 2022
- January 2022
- December 2021
- August 2021
- July 2021
- June 2021
- March 2021
- February 2021
- January 2021
- December 2020
- November 2020
- August 2020
- July 2020
- June 2020
- May 2020
- April 2020
- March 2020
- February 2020
- January 2020
- December 2019
- October 2019
- September 2019
- July 2019
- June 2019
- May 2019
- April 2019
- March 2019
- February 2019
- January 2019
- December 2018
- November 2018
- September 2018
- August 2018
- July 2018
- June 2018
- May 2018
- April 2018
- March 2018
- February 2018
- January 2018
- December 2017
- November 2017
- October 2017
- September 2017
- August 2017
- July 2017
- June 2017
- May 2017
- March 2017
- February 2017
- January 2017
- December 2016
- November 2016
- October 2016
- September 2016
- August 2016
- July 2016
- June 2016
- May 2016
- April 2016
- March 2016
- February 2016
- January 2016
- December 2015
- November 2015
- October 2015
- September 2015
- August 2015
- July 2015
- June 2015
- May 2015
- April 2015
- March 2015
- February 2015
- January 2015
- December 2014
- November 2014
- October 2014
- September 2014
- August 2014
- July 2014
- June 2014
- May 2014
- April 2014
- March 2014
- February 2014
- January 2014
- December 2013
- November 2013
- October 2013
- September 2013
- August 2013
- July 2013
- June 2013
- May 2013
- April 2013
- March 2013
- February 2013
- January 2013
- December 2012
- November 2012
- October 2012
- September 2012
- August 2012
Categories
- ADXY Index
- Agnico Eagle Mines
- AI Artificial Intelligence
- Alcoa
- Amazon
- AngloGold Ashanti
- Antofagasta
- APPL
- Apple
- ASX 200
- AUD vs USD
- AUDNZD
- AUDUSD
- Australia ASX 200
- Baltic Dry Index
- Banking
- Base Metals
- Biotechnology
- Bitcoin
- Bovespa
- Broadcom
- Catalexit
- central banks
- Christmas
- Commodities
- Commodities Video Outlook 2020
- Conference
- Copper
- Coronavirus Sell-Off
- CRB
- Crude oil
- crude oil price chart
- CryptoCurrency
- Currencies
- Currencies + Interest Rates Video Outlook
- Cycles
- Dax 30
- deutsche bank
- Dewey Cycle
- DJ Transportation Average
- DJ Utilities
- Dow Jones 30
- Dow Theory
- ECB
- economy
- Elliott Wave
- Elliott Wave Charts
- Elliott Wave Patterns
- Elliott Wave Principle
- Emerging Markets
- Ending-Diagonal Elliott Wave Pattern
- Equity
- EUR vs CHF
- EUR/USD
- Euro / US$
- Eurostoxx 50
- EuroStoxx50
- EuroStoxxBanks
- EURUSD
- Expanding Flat Pattern
- FAAMG
- FANG+
- fib-price-ratio
- Fibonacci Trading
- Fibonacci-Price-Ratio
- Financial Forecasting
- Fixed Income
- forex
- Freeport McMoran
- FTSE 100
- Fund Management
- FX
- FXStreet
- GBP/AUD
- GBP/USD
- GDX
- GDXJ
- Germany 10 year Euro Bund future
- Gilead Sciences
- Glencore
- Global Economy
- Gold
- Gold Mining
- Golden Ratio
- goldman sachs
- Google Inc.
- Google/Alphabeth
- Greek debt crisis
- Hang Seng
- Harbinger
- Hungarian Forint
- IBEX 35 Index Spain
- Independent Research
- India-CNX Nifty 50
- Interest Rates
- Interview
- IRP Independent Research
- kbw bank index
- Lonmin
- MAG-7
- McDonald's
- MID-YEAR VIDEO UPDATE!
- Mifid II
- Mines
- Mining
- MSCI China
- MSCI Emerging Markets
- Nasdaq 100
- Nasdaq Biotechnology Index
- Nasdaq Composite
- Nasdaq100
- Netflix
- Newmont Mining
- Nikkei 225
- NVIDIA
- NYSE Composite Index
- Palladium
- Platinum
- Precious Metals
- Ralph Nelson Elliott
- Reversal-Signature
- Russell 2000
- Russia RTS
- S&P 500
- Sector
- Secular-Bull
- Sentiment Survey
- Shanghai Composite Index
- Silver
- Slanting Flat Elliott Wave Pattern
- SP100
- SP400 Mid-Cap
- SP500
- SPX 500
- STLG/AUD
- Stlg/US$
- STLG/USD
- STLG/YEN
- STLG/ZAR
- Stock Index
- Stock Index Tracking
- Stock Index Video
- Stock Indices
- Stock Indices Video Outlook 2023
- Stock Indices Video Outlook 2025
- Sugar
- Summary
- Tesla
- Tesla Inc
- Toyota
- Track Record
- trading
- Trusts
- Tutorial
- Uncategorized
- UniCredit
- US
- US Dollar Index (DXY) (USDX)
- US$ Index
- US-Dollar Index
- US10yrYields
- USD
- USD/ARS
- USD/CNY
- USD/IDR
- USD/INR
- USD/MXN
- USD/SGD
- USD/THB
- USD/YEN
- USD/ZAR
- Vale
- Value Line Index
- video
- VIDEO OUTLOOK 2018
- VIDEO OUTLOOK 2020
- VIX
- W.D. Gann
- WaveTrack International
- XAU Gold/Silver Index
- Xetra Dax
- XOP
- Yields
- Zig Zag
- Zinc
- ‘INFLATION-POP’
- ‘SHOCK-POP-DROP’