NASDAQ100! What is the Perfect Timer?
by WaveTrack International| December 4, 2017 | No Comments
ENDING-DIAGONAL FOR NASDAQ100 – PERFECT TIMER!!
The S&P 500, Dow Jones (DJIA) and Russell 2000 are each trading higher from their November retracement lows into ‘expanding-impulse’ patterns. Yet, the outperforming Nasdaq100 indicating an entirely different pattern is now underway, one which might just be the perfect timer in signalling the end to the current uptrend.
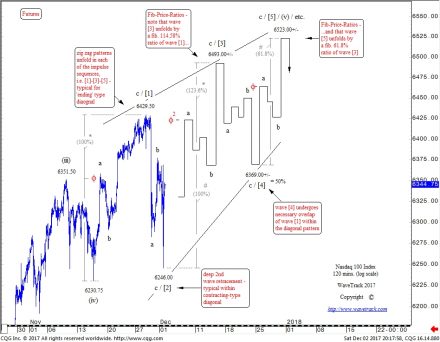
The initial upswing from the mid-November low of 6230.75 (futures) has traded to new higher-highs whilst unfolding into a three wave zig zag pattern. To be exact, i.e. a-b-c, subdividing 5-3-5 and ending at 6429.50 – see fig #1. As we know, the trend cannot be terminal as a THREE wave sequence. It must ultimately complete a FIVE wave pattern. There a limited amount of ways in which a three wave sequence to higher-highs can be reconciled with other major indices. Especially, if these indices themselves are unfolding into ‘expanding-impulse’ patterns, and the most probable is where the Nasdaq100 takes the form of ‘diagonal-impulse’.
This diagonal is specifically an ENDING type, it’s the 5th wave within the larger/aggregate uptrend. What does this mean? It indicates that each of the three impulse sequences, waves [1]-[3]-[5] have a tendency to subdivide into zig zag patterns. Explaining why the November advance unfolded into one, it ended the 1st wave within the developing diagonal.
Nasdaq100 and Fib-Price-Ratios
Last Friday’s sharp decline of the Nasdaq100 to 6246.00 ended a 2nd wave correction, itself unfolding into a zig zag. The 3rd wave is normally slightly larger than the 1st wave’s amplitude. This is why we’ve used a fib. 123.6% ratio to project wave [3] towards upside targets at 6493.00+/-.
A 4th wave correction within a ‘contracting’ type diagonal (not in the case of an ‘expanding’-diagonal) will commonly unfold by a fib. 50% ratio which projects towards 6369.00+/-.
A final 5th wave advance commonly unfolds by a Fibonacci 61.8% ratio of the 3rd wave which projects wave [5] towards 6523.00+/-.
Perfect Timer
The diagonal seems the most reasonable solution for pattern reconciliation with the other major indices. Especially, as they too, finalise uptrends from the mid-November lows. But the Nasdaq’s diagonal has another quality that is useful in projecting a terminal high and that is its TIMING effect. An ‘expanding-impulse’ pattern has no constraints over just how much time is consumed in its completion. For example it can compress less time by accelerating higher or alternatively slow-down its trajectory to consume more time. In either situation, it’s difficult to determine which outcome will ultimately unfold. But the diagonal’s shape and dimension are specific enough within its converging boundary lines to offer relative time consumption before completion.
The factor of time is an important element that defines its shape and dimension. The upper and lower boundary lines must be drawn within parameters of the ‘goldilocks’ angles. If the upper boundary is too acute, i.e. above 38 degrees, then the ‘flattening’ of waves [1]-[3] and [5] are lost, where only marginal higher-highs occur at each successive attempt. In this example of the Nasdaq100, the angle is flatter at 29 degrees. In contrast, the lower boundary must be more acute to create the ‘wedge-shaped’ effect of the diagonal. Yet, if it is too oblique and you end up with a parallel with the upper boundary line.
In this example, the lower angle is at 50 degrees and could be a little more. However, less would destroy the ‘contracting’ dimension of the diagonal. In order to ensure the boundary lines form the contracting-diagonal correctly, time must be a factor. By drawing this as an exercise, especially with fib-price-ratio parameters added, it ultimately projects completion with TIMING as a key element. In the case of the Nasdaq100 ending sometime towards year-end, December ’17.
Conclusion
Like human faces, none are exactly alike, each has its slight permutations or variances. And we expect nothing less from this example of the Nasdaq100 too! By applying a general template of angles, timing and fib-price-ratios, we end up with a tangible reference for completing this uptrend.
Are you trading the Nasdaq100? Don’t miss WaveTrack regular updates in our bi-weekly EW-Compass Report! Ensure you’re tracking our forecasts – subscribe online for the EW-COMPASS REPORT.
Visit us @ www.wavetrack.com and subsribe to our latest EW-COMPASS report!
Comments
Leave a Reply

