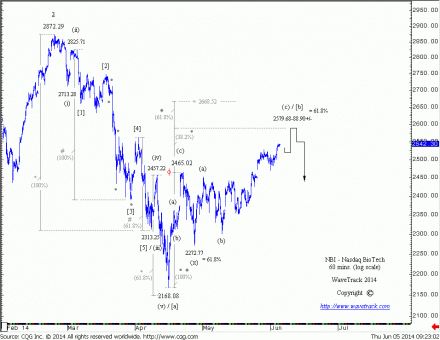
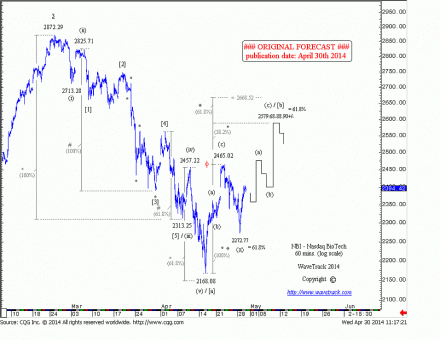
NASDAQ Biotechnology Index (NBI) is taking a more direct route to upside targets
by m.tamosauskas| June 5, 2014 | No Comments
The bearish divergences visible in U.S. stock markets were first identified mid-April when the benchmark S&P 500 index declined into a three price-swing corrective pattern whilst the Nasdaq Bio-Tech (NBI) unfolded during the same period into a five wave impulse – the Elliott Wave Principle (EWP) states that three wave patterns define counter-trend movement whilst five wave patterns define directional ‘trend’.
This difference in wave structure, comparing two indices with a high positive correlation, provides a warning of larger, impending declines. Naturally, the rhythms of up-and-down price movement are synchronised, but the relative outperformance/underperformance creates different Elliott Wave patterns, each unique.
The S&P’s three wave decline into the mid-April ’14 low confirmed its uptrend remained intact, incomplete, with at least another attempt due to unfold into record highs – that has now been realised at levels of 1928.00+/-. In contrast, the Nasdaq Bio-Tech (NBI) index’s decline into a five wave pattern to the mid-April low at 2168.08 confirms it has already ended its uptrend earlier, into its late-Feb.’14 high of 2872.29 and has begun a durational 2-3 month decline. This is valuable difference because it informs us that the S&P’s advance to record highs is somewhat limited – because the Nasdaq Bio-Tech (NBI) is simply synchronising the same upswing but as a counter-trend pattern.
Comments
Leave a Reply


