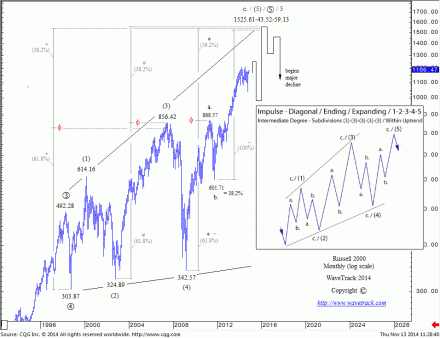
Long Term Russell 2000 Forecast
by m.tamosauskas| November 13, 2014 | No Comments
This is a powerful long-term chart basis fib-price-ratio measurements. Why? Well, it shows a quadruple convergence in a very tight price range between 1525.61-59.13 which usually attracts prices like a magnet. You won’t find many charts like that. Moreover, the advance that began from the October ’98 low of 303.87 is taking a specific Elliott Wave pattern – ending expanding-diagonal (see inset chart). This is composed of five price-swings where each of them must subdivide into smaller single/double zig zag sequences. The last price-swing within diagonal pattern began from the March ’09 low of 342.57. It is unfolding into a single zig zag pattern, labelled a.-b.-c. in minor degree. Minor wave c. so far, is clearly shorter than minor wave a. (in log scale), a fib. 100% equality ratio would be met at 1525.61. Shorter waves ‘C’ within a single zig zag pattern is an outside probability and this suggests that the current bull market that began from the 2009 lows has still enough upside potential during our ‘inflation-pop’ scenario. Interestingly, the price development of the Russell 2000 is very similar to Hang Seng and Singapore Straits Times indices. Those Asian indices are also developing into the same EW pattern from the ’98 lows.
Tags: elliott wave > Forecast > Hang Seng > Russell 2000 > Singapore Straits Times
Comments
Leave a Reply

