Interim update – S&P 500
by m.tamosauskas| February 12, 2014 | No Comments
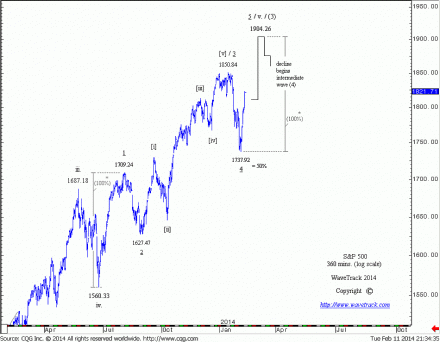
The upside recovery from last Wednesday’s low of 1737.92 has been expected to act as a counter-trend sequence of the January sell-off with upside targets into the fib. 61.8% retracement level at 1806.86 or max. 76.4% at 1824.00+/-. Although this level is only now being tested, the problem is that the rally has had such a sharp trajectory that it’s almost impossible to see any three wave structure that would define this as a counter-trend pattern.
The S&P is not the only index that has accelerated vertically – this includes the Dow Jones (DJIA) and especially the Nasdaq indices that are already close to breaking above the existing January ‘14 highs. This of course would postpone the larger intermediate degree wave (4) declines forecast in recent updates.
It now seems probable that the mid-Jan.’14 sell-off was in fact a counter-trend pattern within the existing uptrend in progress from the June ’12 low as intermediate wave (3). Subdividing wave (3) into a five wave pattern relocates its fourth wave low, minor wave iv. four, into the June ‘13 low at 1560.33 – see fig #1. Then, subdividing minor wave v.’s five’s advance into a smaller five wave sequence as 1–2–3–4–5 would locate last week’s low at 1737.92 as wave 4. This would explain the explosive upward acceleration that has continued this week as wave 5 is now in upside progress to new record highs.
A minimum upside target now projects to 1904.26 and this is derived where waves 1 and 5 measure equally, oscillating to a fib. 100% equality ratio. This is not too far above the 1885.26 number that is measured from extending minor wave i. one by a fib. 161.8% extension ratio. A higher level towards 1931.33 is calculated by taking a fib. 61.8% correlative ratio of waves 1–3 = 5 but this seems to overdo it especially when comparing with the potential of other indices.
Comments
Leave a Reply

