EuroStoxx and SP500 – Relax, Don’t Do It (Sell!)
by WaveTrack International| March 28, 2018 | No Comments
staging a reversal-signature that begins the next advance towards 2854.75+/-, a gain of +11% per cent over the coming month
Tuesday’s late-session technology sell-off has eroded Monday/Tuesday’s gains following a downside test to fib-price-ratio targets last Friday which marked the ending of the Nasdaq 100’s corrective pattern from the Feb. 27th high. Furthermore, Monday/Tuesday’s advance from this low has now been isolated as unfolding into a three wave sequence, a counter-trend zig zag pattern which indicates Tuesday’s late-session decline is attempting to break below last Friday’s lows. But how far can this additional decline go?
The media has created tension and anxiety in overnight reporting which has the markets believing in a sustained decline. But our Elliott Wave analysis tells us otherwise.
Eurostoxx 50 Zig Zag – S&P 500 Expanding Flat
Comparing Europe’s benchmark index, the Eurostoxx 50 and the U.S.’s S&P 500 tells us to expect a dramatic upside recovery within the next days.
They share something in common – both began counter-trend declines from the February 27th highs – a zig zag pattern for the Eurostoxx 50 and an expanding flat for the S&P 500. When different patterns exist like this, but are positively-correlated, then a high-probability event can be determined. Yes, the indices could squeeze out one additional lower-low, i.e. below Friday’s lows, but not too far before they complete.
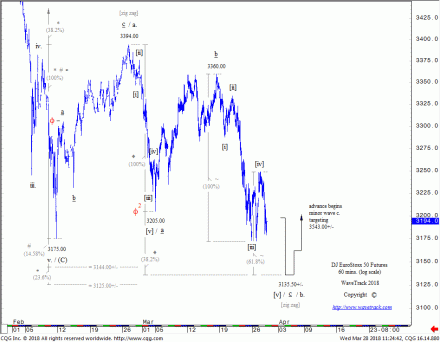
The Eurostoxx 50’s zig zag decline has a convergence of fib-price-ratio downside targets towards 3135.50+/-. See fig #1. That’s not too far below Friday’s levels of 3173.00. The zig zag is labelled a-b-c in minute degree, subdividing 5-3-5 – extending wave a by a fib. 38.2% projects a terminal low for wave c to 3135.00+/-. Also, the 5th wave of wave c, labelled wave [v] unfolds by a fib. 61.8% ratio of waves [i]-[iii] at 3135.00+/-, thus forming a convergence-matrix.
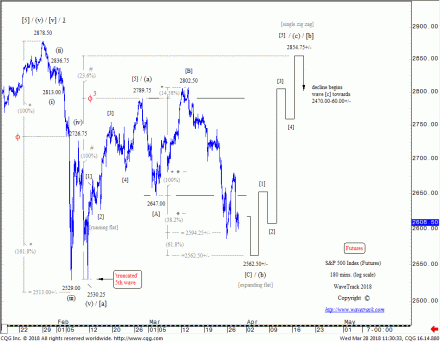
The S&P 500 has unfolded into an expanding flat during the exact same time-period – see fig #2. This began from 2789.75 and labelled [A]-[B]-[C] subdividing 3-3-5. There was a question-mark whether the five wave impulse decline as wave [C] was completed last Friday, but it now seems it wasn’t – this can extend a little lower, but not a lot lower targeting 2562.50+/-. But this ends the expanding flat, opening the way for a dramatic upside recovery, targeting 2854.75+/- during the next month.
Conclusion
If you listen/watch the media hype, you can easily be seduced into thinking the stock market is about to plunge lower – but this is far from the truth. U.S. and European indices are simply ending counter-trend corrective patterns that began from the Feb. 27th highs – completion is just days away, releasing some impressive gains through the coming month.
Are you trading S&P 500, EuroStoxx, Nasdaq 100, Russell 2000, Dow Jones 30, Dax, FTSE100, Shanghai Composite, Hang Seng or ASX200? Don’t miss WaveTrack’s regular updates in our bi-weekly EW-Compass Report! Ensure you’re tracking our Forex forecasts – subscribe online for the EW-COMPASS REPORT.
Visit us @ www.wavetrack.com and subsribe to our latest EW-COMPASS report!
Comments
Leave a Reply


