Elliott Wave Tutorial | Wave Structure – Pattern Dimension & Fib-Price-Ratios
by WaveTrack International| May 3, 2018 | No Comments
Q. I have a query about [WaveTrack’s] Elliott Wave EuroStoxx50/European indices analysis – could the entire decline from the Nov.’17 peak be labelled as a W-X-Y corrective pattern ending into the late-March ’18 low? – and a new uptrend beginning from that point ending the 1st wave now within a progressive five wave advance?
A. Thanks for your question. Your labelling of the 4th wave decline from the Nov.’17 high as a W-X-Y is actually a double zig zag, a-b-c-x-a-b-c, or 5-3-5-X-5-3-5. Re-labelling this helps to focus the correct subdivision for each wave sequence.
Pattern Dimension
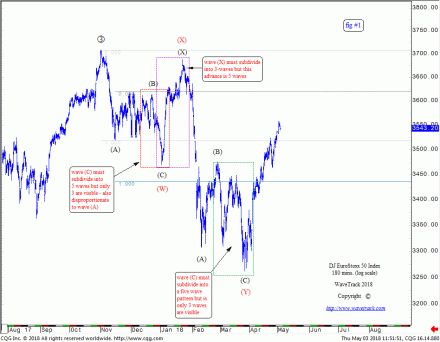
Fib-price-ratio and proportion is evenly weighted in the assessment. This reveals the ‘dimension’ for each pattern which is very important. The reason why we developed proportional/dimensional guidelines for each of Elliott’s 13 patterns is to ensure correct counting. Your labelling raises the perfect example. For example, we’ve added your count in fig #1 (see below). You’ve suggested an (A)-(B)-(C) zig zag decline from the Nov.’17 high ending into the Jan. 2nd low. But wave (C) doesn’t subdivide into the necessary five wave sequence. Nor does it fit the profile of wave (C) because it is far too short relative to wave (A).
Fib-Price-Ratios
Short ‘C’ waves within zig zags often lead to incorrect counting. But unfortunately, this is too often seen in the Elliott Wave community. Yes, they can be short but -in our experience- rarely so. More common measurements are where waves ‘A’ & ‘C’ measure equally by a fib. 100% correlative ratio or when extending wave ‘A’ by a fib. 38.2% or 61.8% ratio projects the terminal level of wave ‘C’. However, only use the 38.2% ratio extension if wave ‘B’ is a 50% retracement or more. Otherwise, use 61.8% – this guideline prevents wave ‘C’ being too short.
Wave Structure
You’ll notice we’ve added some text to the charts. Wave (X) must be a three/seven/eleven wave sequence in your labelling to evoke a correction. For example a zig zag/single/double/triple, but it is clearly a five. And finally, wave (C) within the secondary zig zag is undoubtedly a three wave sequence but basis you count, this would have to be a five.
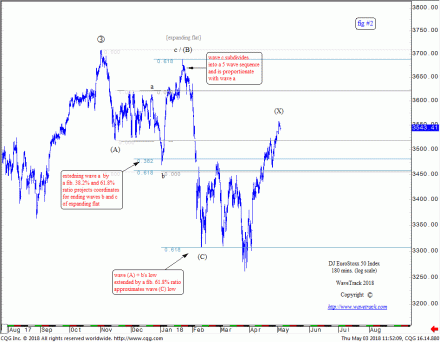
So now let’s take a look at our existing count in fig #2 . Wave (B) within the first zig zag fits perfectly to an expanding flat. The pattern subdivides 3-3-5 and it measures like an expanding flat where wave ‘a’ is extended by a fib. 38.2% or 61.8% ratio – extending wave (A) but including the ‘b’ wave low by a fib. 61.8% ratio projects in close proximity to wave (C)’s low…a little overshoot, but only by a single daily bar-spike.
Elliott Wave – Consistency and Success
The February-March decline measures as a zig zag…no short ‘c’ wave here, so perfect…and so, this count complies with both form, subdivision and proportionality. If this method and approach is used consistently, it will produce consistent results because the markets unfold in regular recurrence to these guidelines…and it eliminates a large part of subjectivity which as you know, is the Elliott Wave ‘curse’!
Yes, sometimes, counts slip through the net, but this will be small in comparison to the victories! Let’s see how the Eurostoxx 50 pans out – at the very least, you’ve constructed a good ‘alternate Elliott Wave count’!
All the very best,
Peter & the Elliott Wave Analysis Team @ WaveTrack International
Are you trading the EuroStoxx, Nasdaq100, S&P 500, Russell 2000, Dow Jones 30, Dax, FTSE100, Shanghai Composite, Hang Seng or ASX200? Don’t miss WaveTrack’s regular updates in our bi-weekly EW-Compass Report! Ensure you’re tracking our Forex forecasts – subscribe online for the EW-COMPASS REPORT.
Visit us @ www.wavetrack.com and subsribe to our latest EW-COMPASS report!
Comments
Leave a Reply


