Elliott Wave pattern of the month (US$ Index)
by m.tamosauskas| May 22, 2015 | No Comments
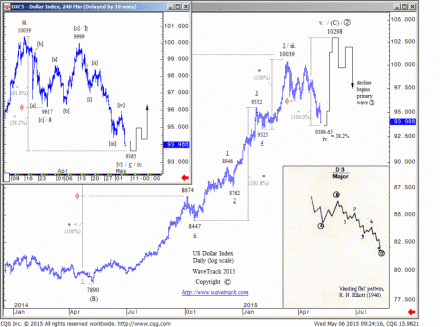
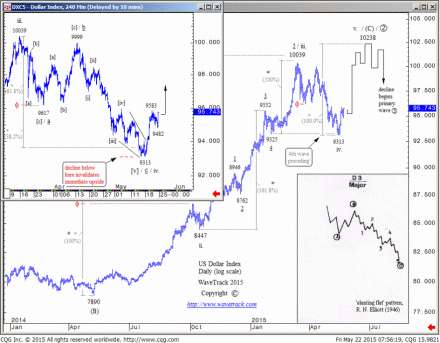
This month, we monitored a rare pattern that was described by R. N. Elliott himself in 1946. It is a variation of the standard flat sequence that is characterised by a 3-3-5 subdivision of its three price swings. The important difference to a ‘standard’ horizontal flat is that the ‘b’ wave of the pattern falls short of the beginning of the ‘a’ wave but the ‘c’ wave exceeds the beginning of wave ‘b’. This produces a ‘slanting’ appearance.
We spotted this pattern in the US$ index as it declined from its March high of 100.39 into a low of 96.17 in a three wave manner. This was followed by a three price swing advance to 99.99. For an Elliott Wave practitioner, this would have implied a double zig zag decline from 100.39 but the accelerative decline from 99.99 clearly showed the characteristics of a five wave impulse sequence. Therefore, the ‘slanting flat’ was adopted in our 6th of May issue that showed an idealised completion level to 93.65 based off a fib. 61.8% extension of the initial three price-swing decline to 96.17.
During the last several trading days, this target was approached and the US$ began a multi-day reversal. Although it dipped slightly lower, this was still in line with the larger outlook – the entire downswing from 100.39 pinpointed the area of ‘4th preceding’ at 9325+/-, an important retracement level for impulse waves. Now, the US$ index has verified the reversal and is poised for continued upside in the weeks ahead.
Comments
Leave a Reply


