BITCOIN – BUBBLE OR NO BUBBLE?
by WaveTrack International| September 13, 2017 | No Comments
Bitcoin – To Be or Not To Be?!
Much hype has surrounded Bitcoin over the last few years but especially this year since prices of the crypto-currency have gained by a phenomenal +555% per cent! So far, I’ve resisted various requests to look into the Elliott Wave pattern development of Bitcoin, mainly because its data-history is relatively short, beginning from July 2010 which shortens the odds of making reliable long-term price forecasts. But also because its reason for existence relies on the idea that we shouldn’t trust the banking system allowing users to transact outside the system.
Executive Order 6102
That’s all sound logic except when you realise that governments can control transactions just as they did back in year-1933. This was when Executive Order 6102 was implemented by President Franklin D. Roosevelt which prevented the ownership of gold coin, bullion, certificates by any individual, partnership, association or corporation. Several notable arrests were made as confiscations continued within U.S. borders. If history has a precedent like this, yes, it can repeat sometime in the future given the right conditions of financial stress.

Gold Coin, Gold Bullion Confiscation by the order of the President – 1933 – image source by courtesy of Wikipedia
A modern day example surfaced in Monday’s press – the Chinese government announced it is planning to shut down platforms that transact in the buying and selling of Bitcoin. The Bank of China has led a draft of instructions that would ban Chinese exchanges from providing virtual-currency trading services. Furthermore, Chinese authorities have now declared the mechanisms that raise funding for crypto-currencies or Initial Coin Offerings (ICO’s) as illegal. How much further are these restrictions going to go?
Does this mean that we shouldn’t invest in Bitcoin? After all, many analysts are voicing concerns of a bubble that is about to burst!
Well, there’s always a chance that other governments will also close down crypto-currency platforms – that is the risk we face. But from an Elliott Wave perspective, the exponential uptrend seems likely to continue over the next year or two.
Bitcoin – Cryptocurrency – No Bubble!
A 5th wave advance began from the Jan.’15 low of 170.00. It began building into a typical step-like 1-2-1-2-1-2 sequence until earlier this year, in January ’17 when it finally underwent ‘price-expansion’ which characterises its 3rd-of-3rd-of-3rd wave acceleration. This is where this year’s gain of +555% per cent comes from. So far, this third wave impulse pattern remains incomplete, aiming for price levels towards 6932.00+/- (yes, that’s a gain of +62% per cent from current levels of 4261.00). And even after a corrective decline, the is more upside potential going forward to complete the larger five wave pattern from the Jan.’15 low.
Shorter-Term – Fib-Price-Ratios
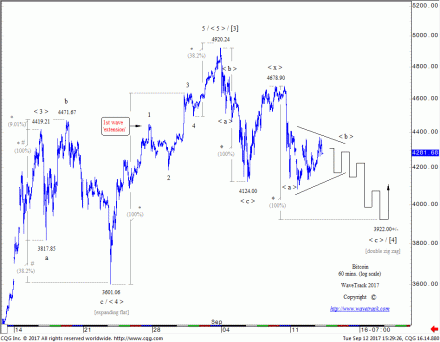
Within this year’s 3rd-of-3rd-of-3rd wave advance, it’s finalising fifth wave advance began pulling prices higher from the July ’17 low of 1905.96 (intraday recorded 1809.26). Furthermore, this subdivides into a five wave pattern labelled in micro-degree, [1]-[2]-[3]-[4]-[5]. Wave [4] is currently engaged in a corrective decline from the current all-time-high of 4920.24 – see fig #1.
It seems that Bitcoin unfolds into the overall rhythms and patterns defined by the Elliott Wave Principle. In this chart, we can see the finalising sequences of wave [3] advance. Its fourth wave subdivision, labelled wave < 4 > can be seen taking the form of a symmetrical expanding flat pattern from 4419.21 to 3601.06. Note the adherence of fib-price-ratios, where wave ‘a’ from 4419.21 to 3817.85 is extended by a fib. 9.01% ratio to project the high for wave ‘b’ to 4471.67 and by a fib. 38.2% ratio for wave ‘c’ to 3601.06.
The following advance as wave < 5 > unfolds into a five wave impulse pattern which includes an uncommon 1st wave ‘extension’. Its finalising fifth wave unfolds by a fib. 38.2% ratio of the net gain in the first-third sequence projecting close to the high at 4920.24.
A Counter-Trend Decline
The high at 4920.24 ended micro-wave [3] which originated from the July 26th low of 2409.21. Wave [4] has since begun a counter-trend decline, taking the form of a double zig zag pattern, labelled < a >–< b >–< c >–< x >–< a >–< b >–< c >. This appears incomplete with the pattern projecting more declines over the coming week or two.
The first zig zag ended at 4124.00 earlier this month (September) with wave < x > subsequently ending a rally to 4678.90. Should fib-price-ratio equality exist, then the secondary zig zag will ultimately test levels towards 3922.00+/-. Extending the first zig zag by a fib. 38.2% ratio projects slightly lower to 3855.00+/-. Once tested, we expect to see Bitcoin resume its larger uptrend.
Conclusion
From an Elliott Wave perspective, there seems little doubt that Bitcoin has much more upside potential, not only in the months to come but the next couple of years. Talk of a bubble burst seems far too early, even though this year’s exponential gains are impressive. The objective is to ride the wave, but get out before the inevitable collapse that will surely follow.
Ensure you’re tracking our forecasts – subscribe online for the EW-COMPASS REPORT.
Visit us @ www.wavetrack.com and subsribe to our latest EW-COMPASS report!
Comments
Leave a Reply

