BITCOIN – CORRECTION ONLY! UPTREND INTACT!
by WaveTrack International| January 4, 2018 | No Comments
Back in September of last year, the Bitcoin frenzy was beginning to pick up. For the first time, going mainstream with pundits forecasting a bubble. That was when the price had just hit 4920.00. It subsequently declined to 2991.00 then traded to almost 20000.00 last December, a gain from that low of +560% per cent.
There was no bubble, so what are those pundits saying now? Well, as you can imagine, silence has fallen. Some big changes have occurred since too. Bitcoin futures is now trading on the CME exchange which allows short-sellers to play the game which means the pro’s have arrived on the scene. Large hedge funds are recording an interest and have begun to trade in these new contracts.
But what about the expected price moves? Last September’s report [extract here] confronted the bubble calls, explicitly affirming there was no bubble. WaveTrack forecasted the decline as simply a counter-trend correction. That proved correct. The fact that September’s decline unfolded into a typical Elliott Wave double zig zag correction, then traded to new higher-highs validated the ongoing pattern sequence of its price development. That pattern sequence is still continuing to this day.
Bitcoin – What Next?
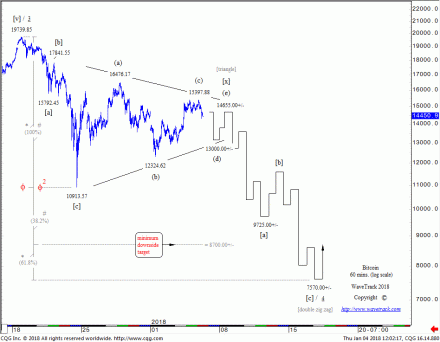
Bitcoin’s decline from December’s high of 19739.85 (CME Bitcoin) 19891.00 (Bitcoin.com) is unfolding into another almost identical double zig zag pattern. Except this one is of larger degree than September’s, labelled in minuette degree, [a]-[b]-[c]-[x]-[a]-[b]-[c] – see fig #1.
The first zig zag ended at 10913.57 on December 22nd, 2017. Its corrective rally since taking the form of a contracting/symmetrical triangle pattern as wave [x]. This is composed of five price-swings, three of which have already completed. And a fourth and fifth are now in progress with an estimated completion towards 14655.00+/-.
We have a trading rule for triangles, which is to always trade the price-extreme of wave ‘C’ because waves ‘D’ and ‘E’ can sometimes fail to emerge. Waiting to trade the completion of wave ‘E’ that never develops can result in missing the strategic trade. If shorting bitcoin is the strategy objective, then this should be done now with stops above wave (a)’s high of 16476.17.
The secondary zig zag is targeting down to two levels, at 8700.00+/- and 7570.00+/-. The 8700.00+/- area is derived by extending the first zig zag to 10913.57 by a fib. 38.2% ratio, the 7570.00+/- area by a fib. 61.8% ratio – probability leans more towards the attempt to 7570.00+/-. If so, then wave [a] of the secondary zig zag is approximated towards 9725.00+/- which creates a ‘golden-section’ 61.8% cut of the entire decline.
Bitcoin – Looking Further Ahead
The short-term triangle pattern is very informative in forecasting the future of Bitcoin’s price development. Because triangles cannot occur within five wave impulse patterns, this would eliminate the concept of December’s decline unfolding into a five wave sequence which would signal a more prolonged downtrend. Rather, it confirms December’s decline is simply another counter-trend sequence within the dominant, prevailing uptrend.
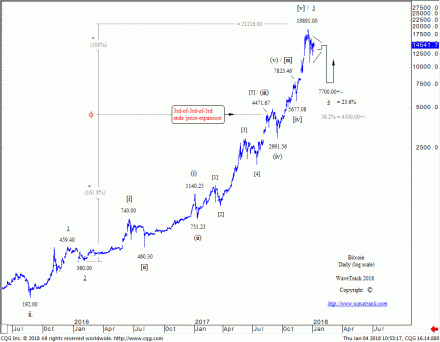
In this next chart, we depict the Elliott Wave pattern development from the August ’15 low of 192.00 – see fig #2. What this chart tells us is that minute wave 3’s advance which began a little later, from the Feb.’16 low of 360.00 ended into the December ’17 high at 19891.00. Both pattern structure and especially, our proprietary Fib-Price-Ratios confirm this as follows: minute wave 3 subdivides into a five wave impulse labelled in minuette degree, [i]-[ii]-[iii]-[iv]-[v] – extending from 360.00 (origin of wave [i]) to the point that ends ‘price-expansion, i.e. the end of the 3rd-of-3rd-of-3rd wave sequence projects the terminal high for wave [v] into December’s high.
A proportional correction of this sequence has since begun, labelled minute wave 4. A fib. 23.6% retracement would pull prices down towards the 7700.00+/- area. This converges with the short-term downside targets towards 7570.00+/- shown earlier.
Conclusion
Once Bitcoin tests these two downside convergence levels between 7700.00+/- and 7570.00+/-, we’ll check the pattern structure to ensure synchronous completion. If all goes to plan, a new ‘buy’ signal will be triggered. That would translate into higher-highs in the months ahead – and another phenomenal return on investment!
Are you trading CryptoCurrencies? Contact us if you would like to see regular updates on Bitcoins? If there is enough interest we are considering to add Bitcoins to our bi-weekly report and/or make it available through WaveTrack’s ‘on-demand‘ service. Leave your comments below or contact us!
Visit us @ www.wavetrack.com and subsribe to our latest EW-COMPASS report!
Comments
Leave a Reply


