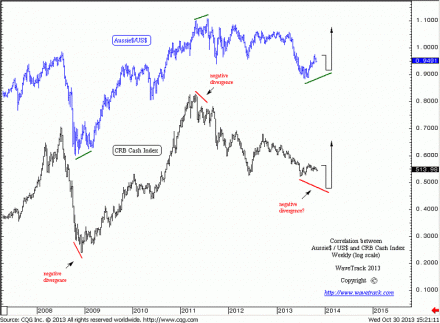
Aussie$/US$ – CRB Cash Index Correlation
by m.tamosauskas| October 30, 2013 | No Comments
Commodity prices are one of the key factors in the Australian economy which combined with global growth and interest rates drives the Australian Dollar. There exists a high correlation between Aussie$/US$ and CRB cash index and by extrapolating the Elliott Wave count for one, we are a step ahead in determining the direction of the other. The base/precious metals component of the CRB-Cash index has been in a counter-trend decline since the index peaked into the May 2011 high of 370.72. The Aussie$/US$ peaked a few months later – in July ’13 at 1.1083. As can be seen, the correlation is not 100% accurate with allowance for a few weeks/months of delay in the larger directional trend changes. The clearest examples of negative divergence between these contracts can be found during the bottoming process in late ‘08/early ’09 and the topping process of May-July ’11. But eventually, the larger trend changes synchronise.
Our latest Elliott Wave analysis shows that the Aussie$/US$ has completed the entirety of its counter-trend decline that began from the July ’11 high into the August ’13 low of 0.8848 whilst the CRB-Cash index retains downside targets towards 472.51 during the next couple of months – this would then create another negative divergence prior to both synchronising in an accelerative advance that begins the last phase of the ‘inflation-pop’.
(The wave labelling for the Aussie$/US$ is shown in today’s EW-Compass report under specially featured bonus chart).
Comments
Leave a Reply

