AUDUSD
by m.tamosauskas| August 13, 2012 | No Comments
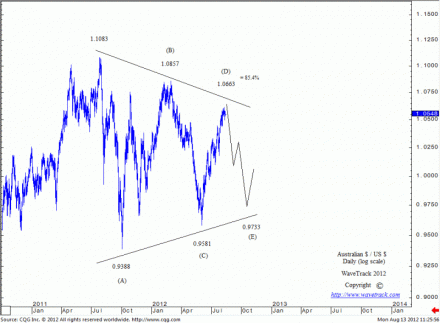
Australian $ / US $ started a counter-trend decline from the July’11 high of 1.1083. It is taking the form of a triangle pattern with ultimate downside targets to 0.9733 that is scheduled to complete late 2012. The triangle is specifically a contracting/symmetrical type, labeled (A)-(B)-(C)-(D)-(E) in intermediate degree. Each wave is retracing about fib. 85.4% of the preceding wave. Intermediate wave (D) is now in progress to the upside from the June ’12 low of 0.9581 and it is expected to finish near the 1.0663 price level (fib. 85.4%). Once completed, the final decline as wave (E) of the triangle will unfold into a three wave zig zag sequence to a measured downside target of 0.9733 (fib. 85.4%). This currency pair is positively correlated to global stock indices – it provides another excellent timing indicator not only for a return lower for the Australian $ / US $, but a reversal signature to confirm the conclusion of the stock market counter-trend advance from the June ’12 lows. Watch for a reversal signature during the next several trading days.
(Become an EW-Compass report subscriber and see how this pattern continues to develop and what’s coming up in the larger time-series).
Comments
Leave a Reply

