ASX 200
by WaveTrack International| January 6, 2016 | No Comments
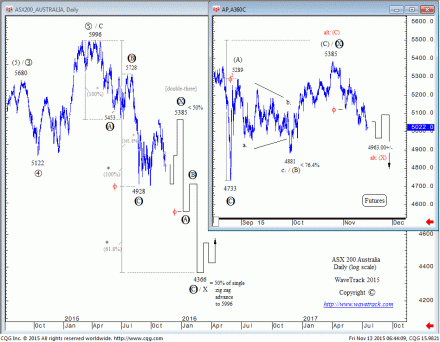
In November, we spotted a very interesting pattern developing for Australia’s ASX 200. The underlying story line is that the index (chart in the background) unfolded into an expanding flat counter-trend correction from its 4928 low whilst the futures (inset chart) synchronised with a single zig zag advance from their corresponding (deeper) 4733 low.
In the 13th November issue of our report, we forecast the ASX 200 to build to the downside in the weeks ahead as this convergence of pattern finalisation (an expanding flat for the index, a single zig zag for the futures) indicated the completion of the entire counter-trend correction labelled wave X in primary degree. But: we also forewarned of a possible halt at the 4963.00+/- level (see futures inset) that was derived by a fib. 61.8% extension of the initial sell-off from the October high of 5385.
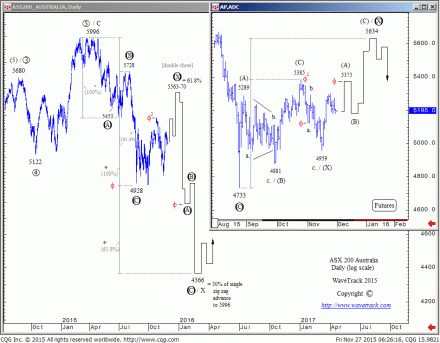
What happened during the following weeks? The ASX 200 traded into a low of 4959 (see inset) and immediately reversed to the upside. This was no coincidence but the proof of well-established fib-price-ratio measurements – when prices react to these, it is almost always a strong sign of a more pronounced change in direction. In terms of the current situation for the ASX 200, it meant that the downswing from the October high of 5385 was only a temporary pullback – primary wave X would have to extend into a more complex correction: in case of the index, into a rare double three sequence (see background chart); in case of the futures, into a progressive double zig zag pattern (see inset).
Don’t forget – our bi-weekly Elliott Wave Compass report features many short-term updates of various asset classes.
Start your New Year with Success
Subscribe to the EW-Compass here…
Comments
Leave a Reply


