Apple
by m.tamosauskas| December 10, 2012 | No Comments
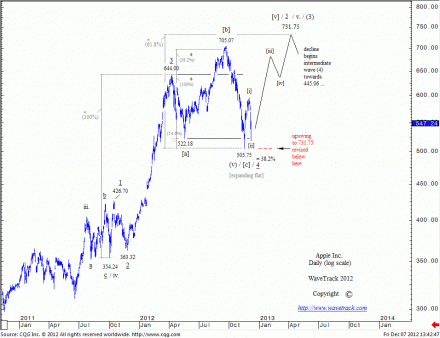
During the last few weeks, Apple Inc. has fluctuated in a volatile trading range between 505.75 and 594.59. There are no changes to preferential wave counts updated recently – a counter-trend decline that began from the April ’12 high of 644.00 completed an expanded flat pattern at the 16th Nov.’12 low at 505.75 and the following advance begins another five wave impulse upswing with targets towards 731.75.
Shorter-term, the advance between 505.75 to 594.59 has unfolded into a five wave (price-swing) formation that asserts continued upside momentum above 594.59 following the 6th Dec.’12 low of 518.63. This is consistent with a continued five wave impulse advance to 731.75 although to validate, prices must accelerate beyond 632.51.
Failure to accelerate above 632.51 would trigger our alternate count (not shown on this blog) that otherwise describes the decline from the September ’12 high of 705.07 to 505.75 as the first stage of a larger counter-trend downswing. A counter-trend rally from 505.75 projects a conclusion to 632.51 prior to a second stage decline with ultimate downside targets towards 445.47. The entire sequence from 705.07 describes a single zig zag pattern labelled a-b-c in minor degree as intermediate wave (4). The difference between these two scenarios is subtle – all depends on the correct identification of the pattern sequence that unfolded during the May-September ’12 advance. As a zig zag, it confirms the Nov.’12 low at 505.75 as completed, whilst as a five wave impulse sequence, this allows a continuation downwards to 445.47. During the next week, both scenarios project a minimum upswing towards 632.51. Its ability to accelerate higher would confirm continuity to 731.75 whilst price-rejection would otherwise confirm a downward attempt to 445.47.
Comments
Leave a Reply

