by m.tamosauskas| November 29, 2013 | No Comments
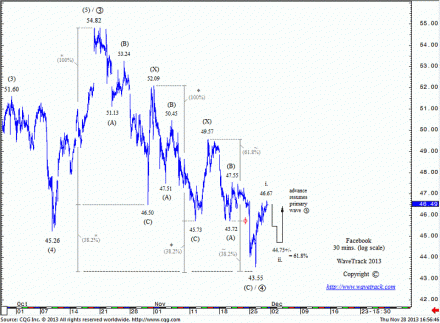
Facebook’s price development is displaying a concise Elliott Wave patterning whilst adhering to geometric ratio and proportion measurements. The focus of this chart is to emphasise the close convergences of various fib-price-ratio measurements at precisely the same price levels – also, the strong price rejection that followed. These were derived by using three different measurements: 1) extending the first zig zag sequence (54.82-46.50) by a fib. 38.2% ratio to 43.32 – 2) extending the secondary zig zag (52.09-45.73) by a fib. 38.2% ratio to 43.30 – 3) extending intermediate wave (A) of the third zig zag sequence by a fib. 61.8% ratio to 43.34. The actual low traded late November at 43.55. We can even the 4th measurement – it tested the fib. 38.2% retracement level of primary wave 3. Ultimate upside targets and the larger picture will be introduced in today’s bonus EW-Compass section! Good luck and have a great weekend!
Comments
Leave a Reply

