Elliott Wave Commodities Update
by WaveTrack International| November 29, 2022 | No Comments
Main Drivers for Commodities are Inflation, Interest Rates and US$ Dollar – Inflation Peak, Rising Interest Rates, Peak US$ Dollar Major Headwinds – Base Metals Completing July’s Counter-Trend Rallies, Heading Lower Now – Precious Metals Bottoming with Short-Term Downside Risk – Energy forming Interim Lows, Heading Higher into Year-End
Commodities Prices – 3 Main Drivers
The main drivers for commodities prices are inflation, interest rates and the US$ dollar.
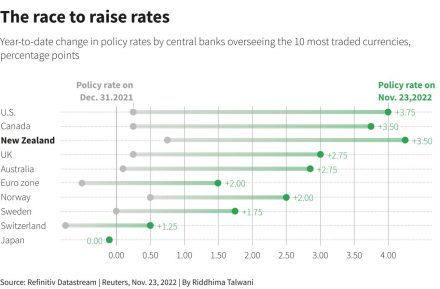
Central Banks have maintained their aggressive pace of interest rate hikes with one or two exceptions. The Reserve Bank of Australia pulled back on its 50bps basis point incremental increased from June to September with only 25bps basis points in the last two meetings. The Reserve Bank of Canada hiked rates by 100bps basis points last July but has since pulled back to 50bps increases in October. The U.S. Federal Reserve have maintained their 75bps basis point increases since June but is hinting it may slow down to 50bps in the next December meeting. Inflation pressures have eased off a little in the U.S.. This is giving rise to peak inflation expectations. However, the big question related to commodity prices is whether this year’s hikes have already dented the world’s economic growth prospects? See fig #1.
CPI/Eurozone Inflation
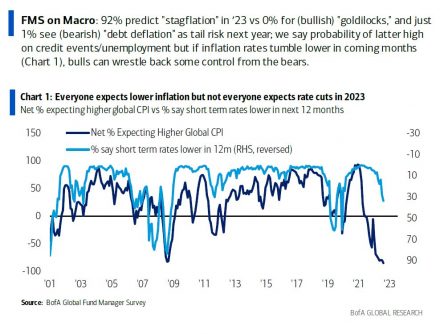
In Bank of America’s latest Global Fund Manager Survey, a massive 92% per cent of fund managers predict stagflation in 2023 – see fig #2 . That means persistent inflationary pressures but at the same time economic stagnation. Central Banks are set to keep hiking during the first quarter of next year in an attempt to bring inflation down. Even if this means sacrificing the global economies. And this combined with more COVID lockdowns in China is creating strong headwinds for commodities into year-end though Q1 2023.
Commodities and Energy
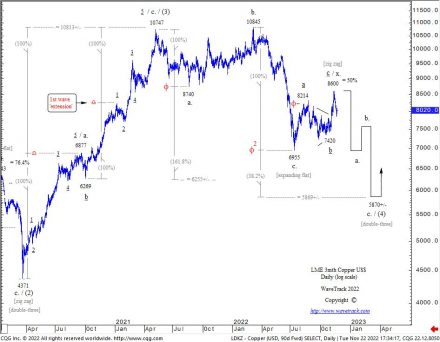
We can see the effect in Base Metals like Copper – see fig #3. Prices have declined a lot over the past year. Precisely, down -35% per cent into July’s low although a recovery since means it’s down now by -20% per cent. However, that’s still massive, and it hasn’t finished yet. July’s recovery has unfolded into an Elliott Wave corrective zig zag pattern ending into the mid-November high. It’s now preparing for another big downswing which is forecast ending sometime into the end of Q1 2023, or beginning of Q2. That’s confirming what most fund managers expect – stagflation.
Commodities and Energy
The energy markets are also showing big declines for Crude and Brent oil next year. Although there’s the prospect of good gains before the next declines begin. We’ll be taking a look at these contracts later.
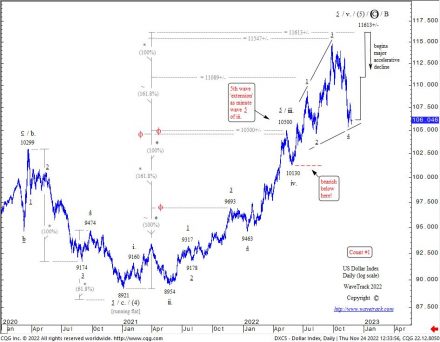
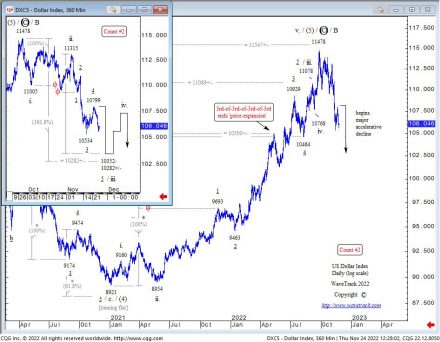
If there’s good news on the horizon, it has to be in Precious Metals. Last month’s report identified a major low in Gold, Silver, Platinum and the Gold Miners. This is still the case. However, there are some downside risks before year-end. This is dependent on whether the US$ dollar undergoes one last push to a modest higher-high, or if September’s high has already peaked – see fig’s #4-5.
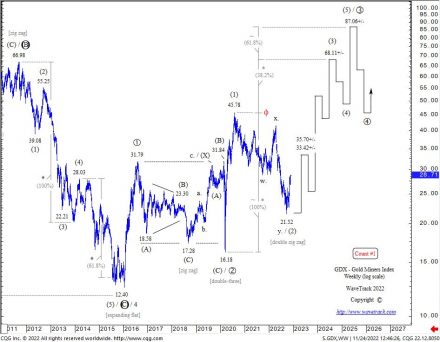
Either way, the Gold Minders have been confirmed putting in a major low and are already trending into a new multi-year uptrend – See GDX Gold Miners index fig #6.
WaveTrack’s EW-Commodities Report has been released. Get more insights about trading opportunities in our latest EW-Commodities Outlook report and video update!
Comments
Leave a Reply
