‘SHOCK-POP-DROP’ & ‘INFLATION-POP’ Explained
by WaveTrack International| October 7, 2022 | No Comments
‘SHOCK-POP-DROP’ & ‘INFLATION-POP’Explained!
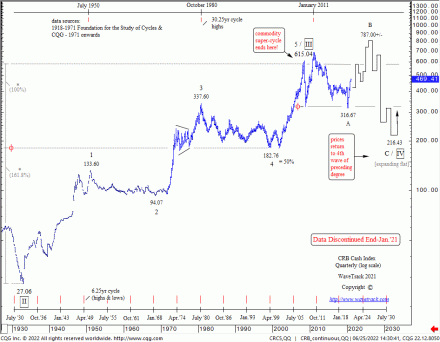
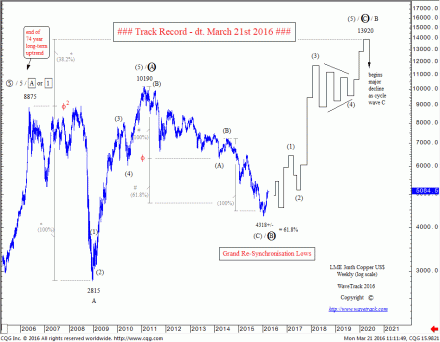
Almost all commodities ended super-cycle uptrends around the year’s 2006-2008. We define the super-cycle uptrend not from the 1999 lows as is generally considered in the financial industry but from the ‘Great Depression’ lows of 1932. This is because most commodities reached all-time lows at that time. Even lower than levels traded several hundred years earlier and this provides a strong basis for historical Elliott Wave analysis. The subsequent uptrend from the 1932 low unfolded into a five wave impulse pattern into the 2006-08 highs, for benchmarks like the CRB-Cash (CCI) index, Copper and Crude oil – see fig #1.
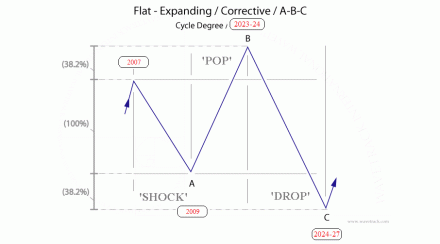
All price action following those peaks in Commodities around 2006-08 is part of a rebalancing correction to the completion of the Super-Cycle uptrend. This correction is forecast unfolding over the next two decades. Perhaps even a little longer with declining prices over that term. In Elliott Wave terms, the correction can only unfold into three types of pattern or categories, Zig Zag, Flat or Triangle. So far, there’s evidence that confirms a Flat or specifically, an Expanding Flat pattern is taking shape. It consists of three main price-swings, labelled A-B-C subdividing 3-3-5. This is assigned the term ‘Shock-Pop-Drop’ – see fig 2.
‘SHOCK-POP-DROP’
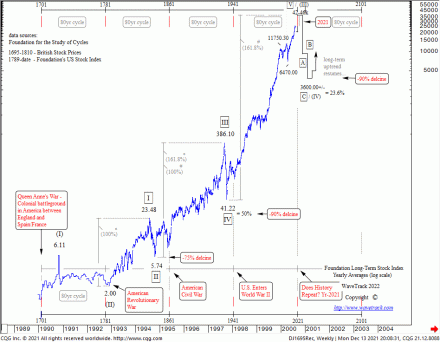
The first ‘SHOCK’ phase develops during the financial-crisis sell-off which comes as a complete surprise to financial markets. The second ‘POP’ phase incites recovery, triggers Central Banks (CB’s) to begin an unprecedented act of Quantitative Easing (QE) forcing asset prices higher but later, inducing Rising Inflationary Pressures until the bubble finally bursts. We’ve specifically termed this the ‘INFLATION-POP’ (we’re experiencing this right now!). That leads to the final third ‘DROP’ phase when financial markets collapse under the weight of debt and excessiveness. As a result, we will see overreaching speculation resulting in massive asset price declines, both stocks and commodities comparable in percentage terms to collapses in stock markets in 1837-1842 (-70%) and 1929-1932 (-90%) – see fig #3.
The financial-crisis that developed in 2007-09 is simply the 1st phase or wave A of the ‘Shock-Pop-Drop’.
The post financial-crisis recovery is the 2nd phase or wave B of the super-cycle correction which is capable of pushing many commodities into new record highs. This phenomenon is not recognised in conventional fundamental/economic or even technical analysis because analysts see this as part of the previous super-cycle uptrend. But the Elliott Wave Principle (EWP) specifically identifies such price development as the 2nd phase of the multi-decennial correction of the expanding flat pattern.
‘INFLATION-POP’
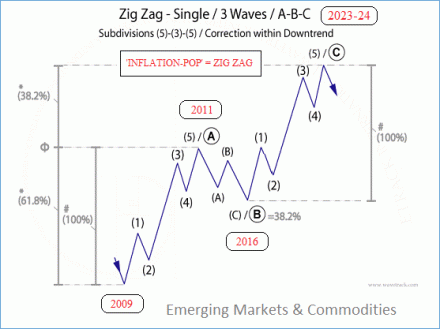
This 2nd phase of the expanding flat can be broken-down into a three price-swing event, up-down-up until prices reach new record highs. We know markets adhere to ‘fractal’ qualities of subdivision and this is a good example. These three price-swings are known as an A-B-C zig zag, subdividing 5-3-5 and given the term ‘INFLATION-POP’. Because it will undoubtedly trigger a resurgence of inflationary pressures by the time prices reach new record highs – see fig #4.
There are three price-swings attributed to the A-B-C zig zag pattern. Wave A represents the first phase of the inflation pop and wave C as the second phase. The first phase ended wave A into the 2010-11 highs. The second phase as wave C began from the Feb.’16 lows for Base Metals but extended into the Coronavirus Pandemic lows of March ’20 for energy markets like Crude/Brent oil and for Platinum.
‘RE-SYNCHRONISATION’
The second phase of the inflation-pop began in January/February 2016. At the time corrective declines in developed (stock) markets formed synchronous lows with Emerging Market and Commodity corrections that began from the year-2011 peaks. We termed this as the grand ‘RE-SYNCHRONISATION’ lows. This is why significant price rises have followed. Now, continuing the secular-bull uptrend for stock markets whilst beginning the next but final third phase of inflationary price rises for EM’s and Commodities – see fig #5.
Labelled as primary wave C (could be cycle wave C for some other commodities), the second phase of price rises are typically unfolding into five price-swings or waves, 1-2-3-4-5. Over a period of several years, into the culmination of the next cyclical peak due around the years-2023-24. In some cases, this could extend to 2025-27. So far, wave 1 ended its advance in Base Metals having taken two-years to develop into January/February 2018’s highs. This has since given way to a period or regression or correction in wave 2. In Elliott Wave terms this is a necessary function before prices can resume higher in wave 3 and so on. Wave 2 completed into the March/April COVID-19 lows for various Base Metals.
The Precious Metals Difference
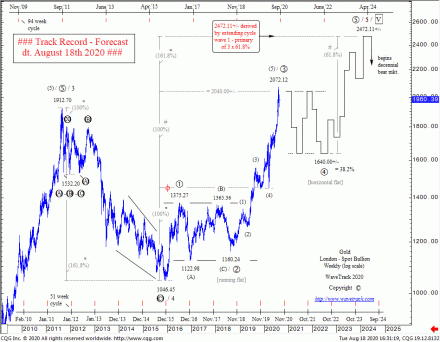
The progress of the inflation-pop for precious metals is somewhat different. They too will succumb to the gradual build-up of inflationary pressures which maintains it within the overall schematic. However, its Elliott Wave pattern progress is different. Gold’s long-term five wave impulse uptrend that dates back to the Great Depression lows remains in upside progress despite trading in Aug.’20 to record highs. Industrial precious metals like Silver and Platinum have a different rhythm but are trending higher during the final phase of the inflation-pop cycle, due to peak latest in 2024-2027 – see fig #6.
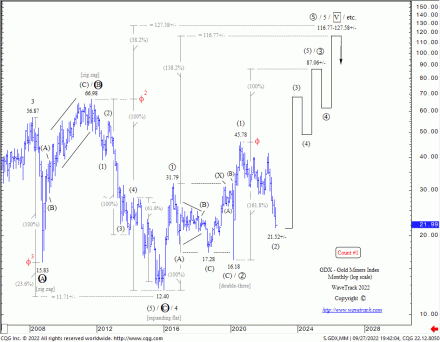
The biggest gains during this next second phase of the Inflation-Pop is expected to be in Equity Miners, both Base & Precious Metal Miners with some multiples of 4:1, perhaps more, measuring from those lows of 2016 – see fig #7.
Get more insights about Commodities trading opportunities in our latest EW-Commodities Outlook report and video update!
Comments
Leave a Reply

