March ’20 Zig Zag Advances Completing 1st Wave Uptrends
by WaveTrack International| March 24, 2021 | No Comments
Advances from the March ’20 COVID-19 Pandemic Lows Unfolding into A-B-C (a-b-c) Zig Zags – Completes 1st Waves within Ending/Contracting-Diagonals as terminal high in Years 2023-24 – 2nd Wave Corrections Unfolding Now – Declines of -35% per cent Over Next 5-8 Months
Growth stocks
Growth stocks led the way during the early stages of the post-Coronavirus pandemic recovery of last year (2020). However, there’s since been a switch of outperformance in value stocks as growth got a bit stretched over the past couple of months. Rotation has also caused periods when large-caps lagged behind the outperforming small/mid-cap stocks/indices. Then there’s been a sudden underperformance in technology stocks/indices as long-dated treasury yields pushed strongly higher, making this industry less competitive relative to the broader market.
Critical Information
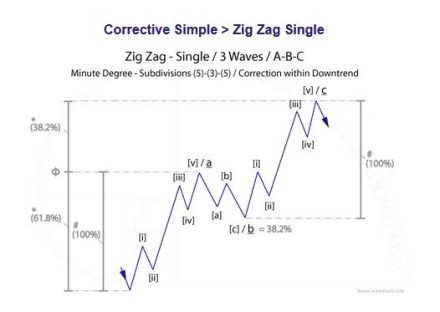
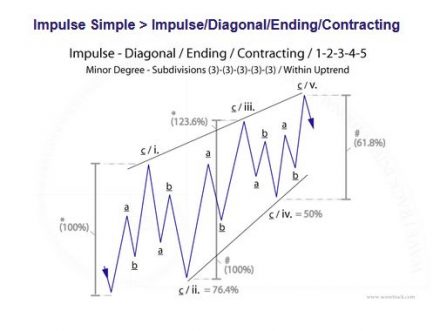
But amidst all of these uneven bumps, there’s emerged a defining Elliott Wave pattern development from the March ’20 COVID-19 lows. So many indices, large cap, mid-cap and small-cap together with several sectors alongside Emerging Markets/Asian indices have all unfolded into A-B-C zig zags. That’s really important. No, critical information because zig zags unfolding directionally higher following crash lows that formed last year can only be positioned in this case, within one type of larger Elliott Wave pattern – and that’s an ending-diagonal.
This month’s report examines how these A-B-C zig zags fit together into their larger degree ending-diagonal patterns across the major indices – see fig’s #1 & #2. But there’s a chilling outcome too. These zig zags are completing the 1st waves within developing five wave contracting-type diagonals which requires deep 2nd wave corrections. That could wipe out the current equity rally with declines of between -30% to -40% per cent over the next 5-8 month period.
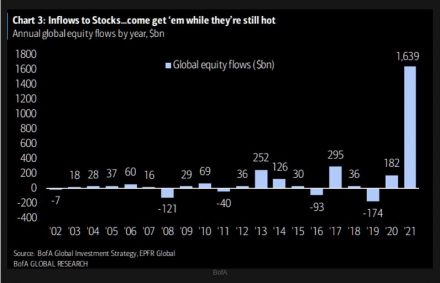
Such a decline could be triggered by any number of exogenous catalysts. For one thing, European countries are heading for a third-wave lockdown. The data backs-up the idea of a strong collapse in equities. Just look at the exponential gains in global equity flows so far this year which dwarfs anything every before – see fig #3. Exponential rises like this always turn into a parabolic curve, resulting in a deep downswing. That in itself could easily translate into a sharp downturn in evaporating fund allocation.
Fund Manager Survey
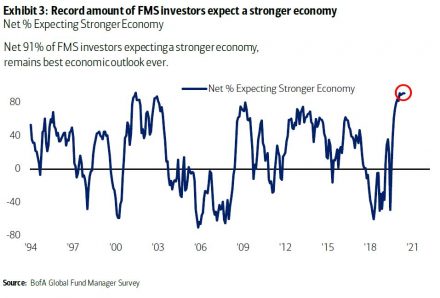
The latest Fund Manager Survey from Bank of America reveals that 91% per cent of FM’s expect a stronger economy for the remainder of this year. This is the highest figure EVER! – see fig #4. If that isn’t a bearish contrarian signal, then what is?
MSCI Emerging Markets
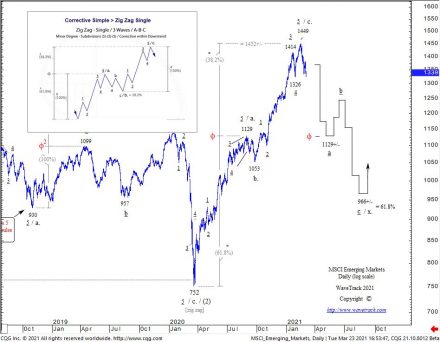
One of the benchmark illustrations of the Elliott Wave a-b-c zig zag advances from last year’s low is shown in the MSCI Emerging Market index – see fig #5. Note how wave a.’s high at 1129.00 x 61.8% equals the terminal high of wave c. at 1449.00. This ‘proofs’ its completion as the 1st wave within the larger degree ending/contracting-diagonal pattern. The final pattern of the secular-bull uptrend.
A huge 2nd wave correction is about to get underway. Ordinarily, 2nd wave corrections within contracting-type diagonals retrace the 1st wave by fib. 76.4% per cent. But in our example, we’ve been more conservative showing the fib. 61.8% ret. level at 966.00+/-. But that’s still a decline of -33% per cent!
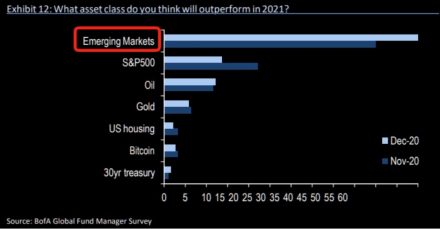
And recently, we’ve seen huge inflows into Emerging Markets. See Bank of America’s FMS survey results which show emerging markets are expected to be the No.1 outperformance asset class compared to the S&P 500, Crude Oil, Gold, U.S. Housing, Bitcoin and US30yr treasuries see fig #6.
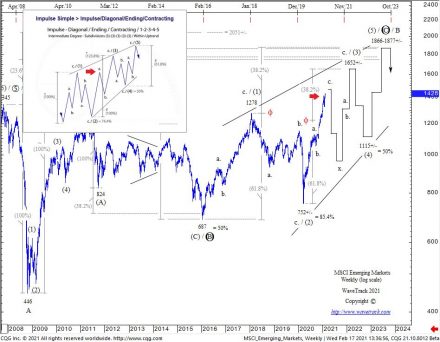
The MSCI EM’s diagonal pattern has been well documented in our Elliott Wave analysis for a number of years. Here’s an update of what it looks like today – see fig #7.
March ’20 Zig Zag Advances Completing 1st Wave Uptrends – read more in WaveTrack Elliott Wave Navigator report!
Comments
Leave a Reply
