Stock Index Mid-Year Video Series – 2020 | PART I/III
by WaveTrack International| June 24, 2020 | No Comments
COVID-19 Aftermath II – Secular-Bull Market Uptrend Resumes!
This report combines ELLIOTT WAVE with updated SENTIMENT & ECONOMIC INDICATOR STUDIES
We’re pleased to announce the publication of WaveTrack’s mid-year 2020 video updates of medium-term ELLIOTT WAVE price-forecasts. Today’s release is PART I, STOCK INDICES – Parts II & III will be published during the next month.
• PART I – STOCK INDEX
• PART II – COMMODITIES
• PART III – CURRENCIES & INTEREST RATES
EW-Forecast Review – H1 2020
The Annual 2020 report published last December (2019) highlighted several main points, including –
Well, a lot’s happened since then! The coronavirus pandemic has decimated global economies with a collapse in almost all areas of manufacturing and services. Only online sales survived the downturn. But even Amazon’s shares traded sharply lower during the worst of the stock market rout in February/March with declines of -25% per cent compared to the benchmark SP500’s decline of -36% per cent.
International Monetary Fund (IMF)
The International Monetary Fund (IMF) has recently made a statement saying the current COVID-19 crisis is ‘unlike anything the world has seen before’. The organisation forecast in April a contraction of -3% for the global economy in 2020. However, the IMF has since said it could be even worse. It noted that the services industry had been more severely impacted than manufacturing. This represents a change from previous crises, where a lack of investment hit manufacturing activity hardest.
The IMF added ‘For the first time since the Great Depression, both advanced and emerging market economies will be in recession in 2020. The forthcoming June World Economic Outlook Update is likely to show negative growth rates even worse than previously estimated’.
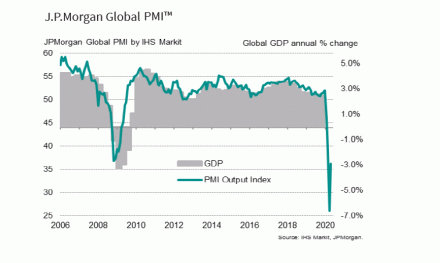
This downbeat assessment has been echoed in the data. The IHS Markit/JP Morgan Global PMI Output Index shows a massive slide lower during the height of the coronavirus pandemic. As a result, the index kept falling from 52.0 down to 26.0 before staging a V-shaped rally from the March/April low – see fig #1. The less sensitive quarterly GDP figures haven’t yet reflected that extreme downturn, but they will do once compiled, but lagging behind.
Enter the Central Banks
In response to the effects of COVID-19 and the lockdowns, central banks and governments have begun an estimated $15 trillion dollars of stimulus in order to protect their economies from systemic collapse. These are record sums that will explode balance sheets and deficits to peacetime highs and to levels that equate to about 17% per cent of an $87 trillion dollar global economy. It’s a massive undertaking.
Stimulus so far – $15 trillion and counting
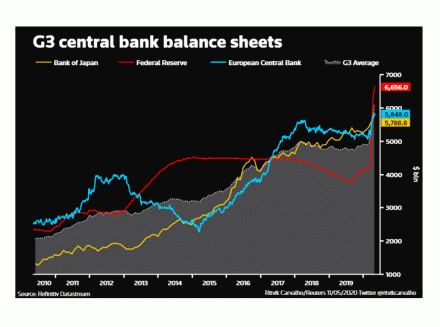
In a Reuters report from Ritvik Carvalho, it states that central banks have so far unveiled as much as $15 trillion dollars of funding into the financial system in an attempt to reverse the economic slump – see fig #2. It’s caused an exponential rise in the balance sheets. And in reaching that number, Reuters has included the increase in central bank balance sheets since the crisis erupted, new government cash injections and spending pledges, as well as about $7 trillion worth of quasi-fiscal loans and credit guarantees. Much of the latter may never be drawn upon, which would reduce the size of the fiscal stimulus. Central banks will also buy more bonds. Some are even saying there is no cap on purchases, inflating the $15 trillion number between now and end-2020.
Earlier this month (June), the European Central Bank (ECB) announced that it will increase its Pandemic Emergency Purchase Programme (PEPP) by €600 billion euros as it attempts to bolster the region’s economy following the coronavirus crisis. The amount is in addition to the existing €750 billion euros of government bond purchases that the ECB announced in March, taking to total to €1.35 trillion euros.
Meanwhile, the Federal Reserve announced its expanding its current stimulus programme to include the purchasing of corporate bonds as a function of its Secondary Market Corporate Credit Facility (SMCCF). The Fed’s stimulus has already exceeded $2.3 trillion dollars and together with various fiscal stimulus by the U.S. government, is expected to be as high as $5.0 trillion dollars.
Coronavirus – 2nd Wave?
Just as lockdowns have been relaxed and economies begin to reopen, so warnings have emerged over a 2nd wave of COVID-19 infections.
‘The second wave has begun’ said William Schaffner of the Vanderbilt University School of Medicine following reports of a spike in infection rates in Arizona, Florida and California. White House health advisor Dr. Anthony Fauci said in a recent announcement that a second wave of the coronavirus outbreak in the United States ‘could happen’ but is ‘not inevitable’.
Mike Ryan, executive director of the World Health Organisation’s (WHO’s) Health Emergencies Programme, said ‘calling instances like these a second wave isn’t quite accurate – most of the world right now is still very much in the first wave of this pandemic’ – it’s not surprising at all that any country coming out of this so-called lockdown can have clusters of disease, reemergence of disease’.
Investors are confused and you can understand why!
Sentiment
In the late-May Global Fund Manager survey conducted by Bank of America/Merrill Lynch, it reported that just 10% of fund managers expected a V-shaped recovery, only 25% a new bull market. In contrast 75% expect a U or W-shaped recovery with 68% believing a bear market rally began from the March lows – see fig #3.
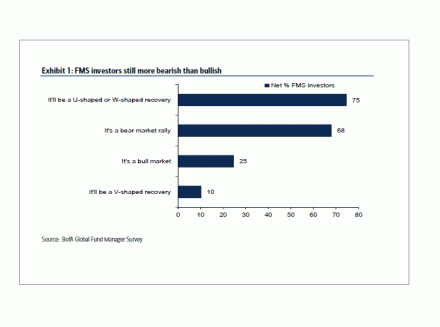
fig #3 – FMS Investors Are Still More Bearish Than Bullish – Source: BofA Global Fund Manager Survey
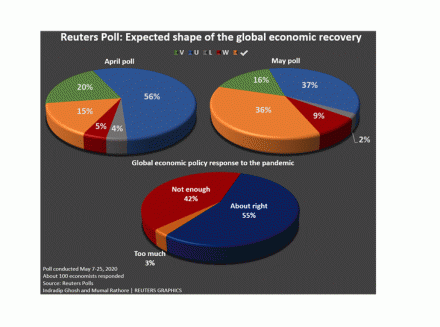
Around the same time, Reuters conducted a similar sentiment poll of more than 250 economists highlighting recessions in most major economies would be deeper this year than previously predicted. Almost three-quarters of economists said the recovery would be either U-shaped, with a prolonged trough, or like a tick mark where the speed of the recovery is not as quick as the drop-off. Only 15 respondents predicted a strong, V-shaped recovery. The others said it would be W-shaped, where a vigorous rebound results in another sharp slump, or L-shaped where the economy flat-lines after the downturn – see fig #4.
From this we can discern that fund managers and economists have been very cautious since the COVID-19 pandemic hit financial markets during February/March’s sell-off – and they haven’t changed their opinions into late-May despite stock markets gaining back most of those -36% per cent losses since March’s lows.
What Next? Elliott Wave Perspective
COVID-19 Aftermath II – Secular-Bull Market Uptrend Resumes!
Despite all the conflicting news stories, COVID-19 vs. Central Banks, the outlook for global stock markets are clearly bullish, at least from an Elliott Wave perspective.
The benchmark SP500 completed a 4th wave correction into March’s low of 2191.86 with a new 5th wave uptrend getting underway since – this explains the V-shaped recovery into the mid-June high – see fig #5. The 4th wave, intermediate wave (4) completed a clearly-defined expanding flat pattern, labelled a-b-c subdividing 3-3-5 from the Jan.’18 high of 2872.87 – all criteria in correctly identifying this pattern were fulfilled, including its overall ‘form’ where wave minor wave a. establishes its initial trading-range ending in Dec.’18 at 2346.58 which is later exceeded slightly as waves b. and c., the former at 3393.52 and the latter into March’s low of 2191.86.
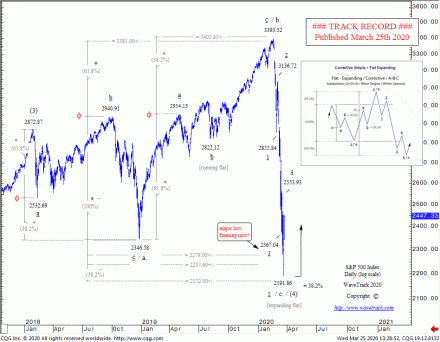
fig #5 – SP500 – Track Record – dated 25th March 2020 – WaveTrack International Financial Forecasting
Importance of Keeping it all in the Right Ratio and Proportion
Another criteria is ratio and proportion. Ratio is fulfilled where the initial downswing within minor wave a. at 2532.69 is extended by a fib. 61.8% ratio in projecting its low at 2346.58. Also, extending the initial upswing of wave b. to 2954.13 by a fib. 61.8% ratio projects the exact high at 3393.52. The final criteria is overall proportionality where minor wave a. is extended by a fib. 38.2% ratio in projecting the terminal low for minor wave c. to 2172.00+/-, the actual low being just 20 points higher at 2191.86.
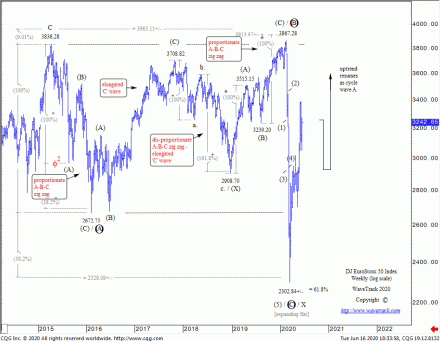
The completion of the SP500’s expanding flat pattern is not a one-off coincidence. This same pattern is replicated in many other indices. Larger expanding flat patterns also completed last March for European indices too, the Eurostoxx 50 and the Xetra Dax. The Eurostoxx 50’s expanding flat is clearly defined because its second sequence, primary wave B has definitively unfolded into a double zig zag pattern, (A)-(B)-(C)-(X)-(A)-(B)-(C) from the Feb.’16 low of 2672.73 nudging to a momentary higher-high last February ending at 3867.28 – see fig #6. The coronavirus sell-off completed primary wave C into the exact fib. 38.2% extension level of primary wave A’s low of 2672.73 at 2302.84, just 26 points from the idealised measurement!
Emerging Markets + Asia – Australia – Japan
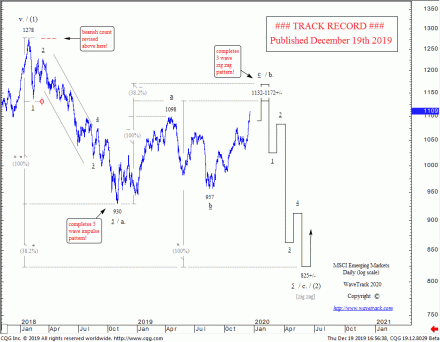
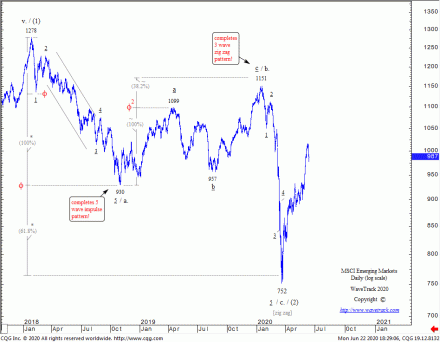
Emerging markets tell the same bullish story. They’re all signalling major coronavirus lows last March. The next two charts echo the same bullish outlook across Asian and the rest of the world’s indices – see fig’s #7 + fig #8.
This shows last December’s MSCI Emerging Market index forecast in preparation for the 2020 annual video report. It forecast a collapse lower as minor wave c. from a price-expectancy high of 1132-1172+/- towards a low of 825+/- that completes a counter-trend zig zag pattern from the Jan.’18 high.
As you can see, the decline began from 1151 then declined to a major low of 752 before staging a reversal-signature upswing. This is confirming a resumption of its much larger uptrend.
Conclusion
Despite all the conflicting news surrounding COVID-19, financial stock markets are giving clearly bullish signs going forward. We’re excited to see these developments and hope you’ll join us in looking through over 70 charts supporting this outlook in our latest mid-year update.
New Stock Index H2-2020 Video – PART I/III
This MID-YEAR 2020 VIDEO UPDATE for STOCK INDICES is like nothing you’ve seen anywhere else in the world – it’s unique to WaveTrack International, how we foresee trends developing through the lens of Elliott Wave Principle (EWP) and how its forecasts correlate with Cycles, Sentiment extremes and Economic data trends.
We invite you to take this next step in our financial journey with us – video subscription details are below – just follow the links and we’ll see you soon!
Most sincerely,
Peter Goodburn
Founder and Chief Elliott Wave Analyst
WaveTrack International
What you get!
Contents: 73 charts – 1 hour 55 mins.
• Economic Sentiment Indicators (9 charts)
• AAII Bullish Sentiment
• Cape P/E Ratio
• Dow Jones 30 + Cycles
• S&P 500 + Cycles
• Russell 2000
• Nasdaq 100
• Dow Jones Transport
• Dow Jones Utilities
• KBW Banking Index
• XLF Financial
• XLK Technology
• NASDAQ Biotechnology
• XLP Consumer Staples
• XLY Consumer Discretionary
• XOP Oil + Gas Index
• EuroStoxx 50
• Xetra Dax 30
• FTSE-100
• FTSE-30
• EuroStoxx Banks
• Deutsche Bank
• UniCredit
• MSCI Emerging Market
• MSCI BRIC
• MSCI China
• China Enterprises
• MSCI Hong Kong
• Hang Seng
• Shanghai Composite
• Bovespa
• Russia RTS
• Sensex
• Nifty 50
• Taiwan SE Weighted
• Singapore Straits
• ASX 200
• Nikkei 225
BUY NOW on WaveTrack’s VIMEO Video On Demand Page
Click here to buy the STOCK INDEX Mid-Year Video Update 2020
*(additional VAT may be added depending on your country – currently US, Canada, Asia have no added VAT but most European countries do)
We’re sure you’ll reap the benefits – don’t forget to contact us with any Elliott Wave questions – Peter is always keen to hear you views, queries and comments.
Visit us @ www.wavetrack.com
Comments
Leave a Reply
