Aftermath of the Coronavirus Sell-off Video Update
by WaveTrack International| March 27, 2020 | No Comments
Aftermath of the Coronavirus Sell-off – Inflation-Pop Diluted but Still On-Track
The coronavirus sell-off in global stock indices has been described by Goldman Sachs as a ‘Black Swan’, a term for an improbable or unforeseen event. Economist Burton Malkiel who authored the 1973 book ‘A Random Walk Down Wall Street’ said he could not spot a recession on the horizon – he also qualified his remarks by saying that predicting a recession is a very difficult task. So was the coronavirus sell-off really an unpredictable, exogenous event or could the downturn have been foreseen?
Coronavirus – Could it have been predicted?
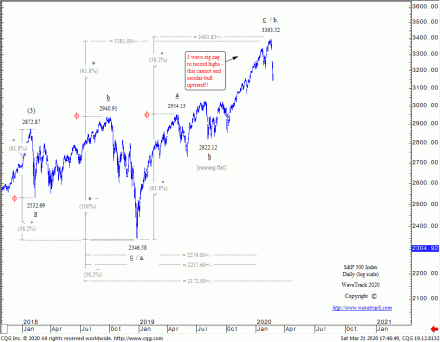
From an Elliott Wave perspective, yes, the downturn and even its amplitude could have been predicted. Our own analysis was blinded by the fact that various positive-correlation studies indicated a limited risk to a sell-off because of the extent of gains in technology stocks combined with a maturing counter-trend downswing in key commodities like Copper from 2018 highs. But there was evidence that heightened the downside risk which means it was certainly plausible to predict the downturn (see ‘Update Alert!’ e-mail dt. February 25th – ‘Increasing Risk of -20% Decline’). Almost all U.S. and European indices completed A-B-C zig zag advances from their Dec.’18 lows into the mid-February highs – and that was the clue to the coronavirus sell-off. See fig #1.
This report updates the S&P 500 and Nasdaq 100 indices which are used as benchmarks for pretty much everything else. The DJ Transportation Average and KBW Banking indices are also updated, giving relevance to the ongoing secular-bull uptrend.
We also update benchmark commodities that are all-so-important in triggering this next but final phase of inflationary pressures – Copper remains on track, heading for record highs as are many other Base Metals – but the coronavirus sell-off in Silver, Platinum and Crude Oil has diluted their participation – but they’ll still have massive gains over the next few years, they just won’t trade to record highs anymore.
Dilution of Inflation-Pop
One of the big ‘take-home’ effects from the coronavirus sell-off is its impact on commodities like Precious Metals and Crude oil. With Silver breaking below its Dec.’15 low of 13.64, that really negates any notion that prices could launch into new record highs during this next but last stage of the ‘Inflation-Pop’ – it’s a similar condition for Platinum too. They will still push dramatically higher over the next few years, but they won’t break to new record highs. Crude oil is similar. Its recent break below the Feb.’16 low of 26.05 to 20.52 has just about negated any chance of it trading to new record highs during the next few years – but it can still test levels towards 99.25+/-.
What this means is the coronavirus sell-off has in some cases, diluted the up-coming advances for several key commodities during this next but last stage of the ‘Inflation-Pop.
That’s not the case for many of the mining stocks though – gold and base metal miners are still forecast to new record highs.
Currencies & Interest Rates
This report also updates the US$ dollar index and several other major currency pairs. In the annual PART III Currencies & Interest Rate report, over 90 charts of different currency pairs/crosses were updated. Many of those forecasts remain unchanged, especially those US$ Dollar/Asian currency pairs which already depicted dollar strength.
There are only modest changes to the US$ dollar index and Euro/US$, more for Stlg/US$ and US$/Yen but this report updates others which have seen severe weakness against the US$ dollar including the Aussie Dollar, Canadian Dollar, Norwegian Krona and Brazilian Real.
Long-dated government bond yields collapsed at the beginning of March. Even though Elliott Wave analysis depicted declines through most of 2019 and into the first quarter of 2020, we didn’t expect the US10yr yield to collapse down to 0.378% per cent! But ‘Update-Alerts’ quickly identified that low as the end of its long-term downtrend, and since, yields have sprung higher to 1.269%. This report examines the trends across varying maturities alongside the latest forecasts for the European DE10yr yield, Italian ITY10yr yield and related spreads.
S&P 500 – End of the Coronavirus Sell-Off
On Friday 20th March, the EW-Compass report commented –
‘The S&P’s rally from last Wednesday’s low of 2262.00 has so far unfolded higher into only a three wave sequence to Friday’s high of 2497.25… could stretch lower towards 2151.00+/- early Monday/Tuesday this coming week…It now seems inevitable that Monday’s opening will test lower levels before reversal-signatures get triggered. European indices alongside several Asian indices were already completing idealised targets last Thursday – which means the U.S. indices require one additional pull lower before re-synchronising’.
Sure enough, come Monday 23rd March, the S&P 500 put in a major low at 2174.00 which has since triggered a major ‘reversal-signature’. The S&P’s gain since has rallied by +21% per cent, setting some new records.
The outlook now turns very bullish despite many analysts crowding around the idea that the secular-bull uptrend has ended with the beginning of an Armageddon collapse on its way – THINK AGAIN! – the evidence suggests otherwise!
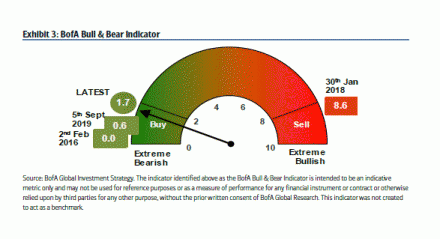
One contributing aspect that supports the idea the coronavirus panic has abated comes from the latest Bank of America/Merrill Lynch sentiment Bull & Bear Indicator – see fig #2. It shows extreme measures of bearishness at a reading of 1.7 – by comparison, the Feb. 2nd 2016 low in major indices produced a reading of 0.0 which as we know, produced a sustainable uptrend afterwards. We all know the risks of interpreting this type of data too literally, but accompanied by Elliott Wave analysis, it offers an insight to what’s ahead.
Update of 2020 Elliott Wave Forecasts
In this latest video/report, we amassed 54 charts updating the major changes from our 2020 annual trilogy series across each asset class, Stock Indices, Commodities, Currencies & Interest Rates together with key Equities from the Mining Sector. These corroborate the next but final stage of the ‘Inflation-Pop’ asset price surge!
We invite you to take this next step in our financial journey with us – video subscription details are below – just follow the links and we’ll see you soon!
Most sincerely,
Peter Goodburn
Founder and Chief Elliott Wave Analyst
WaveTrack International
How to Subscribe:
Contents: 54 charts Time: 1 h 27 mins.
SP500
Nasdaq 100
DJ Transportation Average
KBW Banking Index
EuroStoxx 50
Xetra Dax
Ftse 100
Hang Seng
MSCI Emerging Markets
Nikkei 225
BHP Billiton
Antofagasta
Freeport McMoran
Rio Tinto
Vale
Copper
Zinc
Gold
Silver
Platinum
Newmont Mining
Amer Barrick
Anglo Gold Ashanti
Crude Oil
USD Dollar Index
EUR/USD
STLG/USD
USD/YEN
AUD/USD
USD/CAD
USD/NOK
USD/BRL
US 10yr Yield
USD 5yr Yield
USD 2yr Yield
Germany 10yr Yield
Italy 10yr Yield
HOW CAN YOU RECEIVE THE VIDEO FORECAST?
To receive your VIDEO UPDATE please click here to contact us.
– Please state if you wish to purchase the Aftermath of the Coronavirus Sell-off Video Update March 2020 for USD *48.00 and send us an email to services@wavetrack.com?
– Next we will send you a PayPal payment request and provide you with the video link & PDF report once payment is confirmed. Please know the reply can take up to 6 hours due to time zone differences. But rest assured we will give our best to provide you with the information as soon as possible!
*(additional VAT may be added depending on your country of residence. Currently, the US, Canada, Asia have no added VAT but most European countries do)
We’re sure you’ll reap the benefits – don’t forget to contact us with any Elliott Wave questions – Peter is always keen to hear your views, queries, and comments.
Visit us @ www.wavetrack.com
Comments
Leave a Reply


