New Stock Index Video 2019 Released! Part I/III
by WaveTrack International| January 1, 2019 | No Comments

Stock Index Video 2019 Part I/III
2018’s 4th WAVE CORRECTION APPROACHING A TERMINAL LOW IN Q1 2019!
This report combines ELLIOTT WAVE with updated SENTIMENT & ECONOMIC INDICATOR STUDIES
We’re pleased to announce the publication of WaveTrack’s Annual 2019 video updates of medium-term ELLIOTT WAVE price-forecasts. Today’s release is PART I, Stock Index Video – Parts II & III will be published during January/February.
• PART I – STOCK INDICES
• PART II – COMMODITIES
• PART III – CURRENCIES & INTEREST RATES
2019 Begins With More Declines – Terminal Lows by Q1-2019!
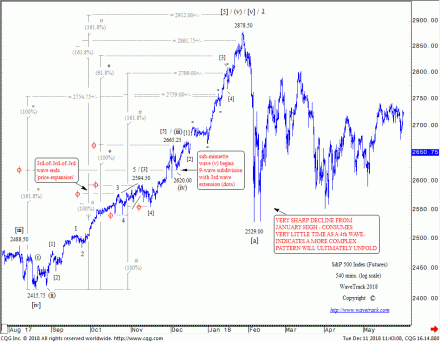
It looks like 2018 set quite a few records! The exponential advance that carried over from December 2017 into January ’18 finally reached a terminal peak on January 31st at 26616.70, Dow Jones (DJIA) and 2872.87, the S&P 500 – both then staged an inverted ‘V’-shaped reversal decline that initially shaved -4.6% off values. CNN reported it was the ‘scariest day on Wall Street in years…the biggest decline since August ’11…the Dow plunged almost 1,600 points – easily the biggest point decline in history during a trading day’. That was only the beginning though! – declines continued through February until it formed a low 2-weeks later but by that time, indices were down by -11.8% per cent.
Volatility continued afterwards – it only took another 2-weeks for the S&P 500 to trade up by +10% per cent – which was just prior to a downswing into the early-April lows, a decline of -8.8% per cent! By that time, sentiment turned really bearish – Investors Intelligence reported that ‘Bulls’ declined from 47.6 to 42.2 which was the lowest bullish reading since right before the US presidential election of November 2016. The number of ‘Bears’ rose marginally but remained at a low historical figure of 18.6.
What did the markets do next?
They ran higher albeit at a more modest pace but advancing by +15.0% per cent until it reached the late-September/early-October highs – then bam! The Dow and S&P collapsed lower.
USA Today reported ‘the U.S. stock market suffered its biggest October decline since the 2008 financial crisis, prompting shaken investors to reassess the staying power of a bull run that began more than nine years ago’. Following rallies into November, markets declined again in early-December. London’s Financial Times reported ‘Volatility leaves Wall Street set for worst December since Great Depression’. Christmas Eve’s (December 24th’s) decline was particularly severe as the Dow (DJIA) gapped lower by 667 points delivering a -19.8% per cent psychological punch from October’s high. The S&P 500 registered a decline of -20.2% per cent, the threshold that many economists define as a ‘bear market downtrend’.
Since those lows, the major indices have recovered by +7.5% per cent.
Drivers & Sentiment
The volatile price-swings of 2018 and the net declines from January’s peak are blamed on the Federal Reserve’s continued monetary tightening and interest rate hiking programme, U.S. President Trump’s trade war with China and its allies and concerns of a global economic recession forewarned by the severe flattening of the U.S. yield curve.
We know just how scared the markets are right now through various sentiment readings. The latest data from AAII showed bulls collapsing 17pts to only 20.9 from the previous week’s level of 37.9. That was the lowest figure since May ’16 – wow! Then on Dec. 19th, Investors Intelligence reported Bulls declined from 46.7 to only 38.3 although most of this downsizing went to the middle-voting with Bears rising 1pt to 21.4.
Snippets of Bank of America/Merrill-Lynch’s fund manager survey for December have appeared on the internet. Highlights include a reading of ‘extreme bearishness’ in equities, a huge jump from long-equities which is now negative -15ppt to long bonds at +23ppt and defensive trades in Consumer Staples at +13ppt (approx.). What does this tell us? – it suggests the equity/stock market is priming itself for a major low although the report itself says that it does not consider its readings as bearish enough to trigger a buy signal!
Review – 2018
With such volatile price-swings over the last year, you might think they’re impossible to predict, but in actual fact, the opposite is true! – THEY ARE PREDICTABLE!
Ray Dalio, the American billionaire and hedge fund manager of Bridgewater Associates sent out an e-mail to clients in December. It had this to say: ‘As you probably know by now, I believe that everything (i.e., all reality) works like a machine with cause-effect relationships that drive what happens, and that to be effective it’s essential to have a good mental model of how those machines/realities work and to have good principles for dealing with them well’. Sounds like an Elliott Waver to me! – ha! But in reality, Ray Dalio looks through the economic lens model – productivity growth, the short-term/long-term debt cycles in coming up with his concept of how the future looks.
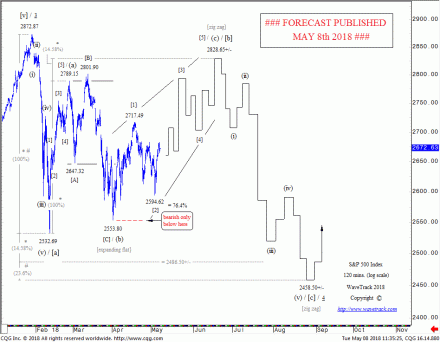
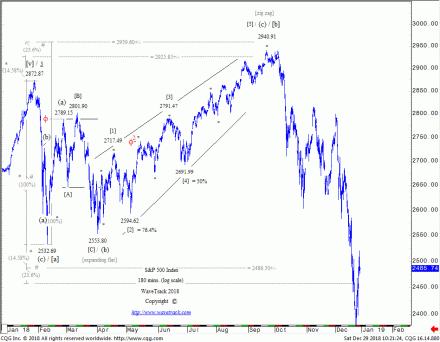
But our resonance-signature prefers to work with the same mechanistic principles of ‘cause-effect’ using a more fluid, non-linear/fractal methodology – the ELLIOTT WAVE PRINCIPLE. This model has correctly identified almost all the price-swings of 2018 –
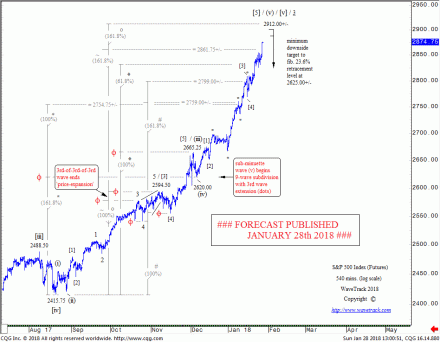
fig #1 Jan. 28th – S&P 500 running exponentially higher but already into upside target range of 2861.75+/- to max. 2912.00+/- that ends the entire advance from July ’16
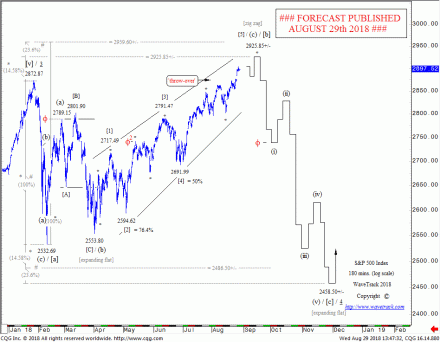
fig #4 August 29th – S&P 500 trading higher but approaching upside targets towards 2925.85+/- then forecasting collapse lower to 2458.50+/-
What Next? Preview for 2019 – U.S. Benchmark Indices
There’s a lot of competing aspects to consider this year and to gain a realistic glimpse of what’s to come, we’re going to have to separate the proverbial wheat from the chaff. That means being unbiased and relying on the facts.
The dominant Elliott Wave theme is that September/October’s highs ended a five wave impulse uptrend that began from the financial-crisis lows of Oct.’08/March ’09 – but is this correct? If the S&P 500 and Dow Jones indices are analysed in isolation, then there is a reasonable chance this ended a five wave ‘structure’. But when examining the same pattern in log-scale and overlaying Fibonacci-Price-Ratio analysis to verify, the pattern begins to degrade – no confirmation is forthcoming.
Back in year-2000 at the height of the dot.com boom and several years later at the highs of October 2007, developed market indices formed corresponding terminal highs with Emerging Markets and Commodities – positive corrections combined with terminal Elliott Wave uptrends formed at the same time. They declined together in corrective synchronisation in the sell-offs that followed. But synchronised EW-pattern highs never happened in 2018. In fact, Emerging Markets and Commodities are still engaged in five wave uptrends that resumed in early 2016 and are far from complete. Yes, they began corrective downswings in 2018 but that’s all. But that means the secular-bull uptrend for U.S. and other global indices is still in upside progress!
This Year’s Stock Index Video Forecast Focus
This year’s 2019 Elliott Wave forecasts takes an updated look at these disparities but aligning them into a synchronised process over the next two-year period. Over 60 charts illustrate the intricate relationships between the U.S., European and Asian/Emerging markets. They combine to tell the same story – we’ve haven’t seen a major peak in the secular uptrend just yet! And even if you have doubts, take a look at some of the sentiment and economic indicators that form part of the holistic viewpoint – the Elliott Wave overlay is pretty convincing!
Worst-Case Scenario
The Stock Index Video 2019 wouldn’t be balanced without a look at the more obvious Secular-Bear scenario. As a result, we’ve added some important slides into the mix. What this does is focus the negation levels at which point a nemesis decline is confirmed. For U.S. indices, price levels would need to break below the Feb.’16 lows whilst unfolding into a five wave impulse pattern to confirm the secular-bear scenario. So let’s see!
European Indices
One of the key aspects to the continued secular-bull uptrend is realised from examining the benchmark Eurostoxx 50 index. Its 2015-16 decline unfolded into a typical THREE WAVE CORRECTIVE PATTERN, i.e. a zig zag. Hence, the following advance into the Nov.’17 high didn’t break above the 2015 high. Consequently, this means there’s still a lot of upside potential to come over the next 18-24 month period, albeit European indices underperforming in 2018.
Emerging Markets + Asia – Australia – Japan
Emerging Markets along with many benchmark commodity markets are unfolding into the ‘INFLATION-POP’ schematic first postulated in these reports back in year-2010. Some indices haven’t broken above the old 2010-11 highs yet. However, this is again another strong indicator that secular-bull uptrends remain engaged to the upside.
New Stock Index Video 2019 – PART I/III
This ANNUAL 2019 VIDEO UPDATE for STOCK INDICES is like nothing you’ve seen anywhere else in the world. It’s unique to WaveTrack International, how we foresee trends developing through the lens of Elliott Wave Principle (EWP) and how its forecasts correlate with Cycles, Sentiment extremes and Economic data trends.
We invite you to take this next step of our financial journey with us – video subscription details are below. Just follow the links and we’ll see you soon!
Most sincerely,
Peter Goodburn
Founder and Chief Elliott Wave Analyst
WaveTrack International
Contents for the Stock Index Video – 68 charts
CONTACT US NOW VIA EMAIL – SELECT YOUR PACKAGE
Single Video – *$48.00 – PART I Stock Index Video 2019 (Jan. ’19)
Triple Package offer – *$96.00 (saving 33%)! – PART I – PART II – PART III (Dec. ’18 – Feb. ’19)
*(additional VAT may be added depending on your country – currently US, Canada, Asia have no added VAT but most European countries do)
PARTS II & III will be available in a few weeks’ time (2019!) – we’re working on it!
HOW CAN YOU RECEIVE THE VIDEO FORECAST?
To receive your VIDEO UPDATE please click here to contact us.
– Please state if you wish to purchase the SINGLE VIDEO – Stock Index Video 2019 for USD *48.00?
– Or opt for the TRIPLE PACKAGE for USD *96.00 in total?
– Next we will send you a PayPal payment request and provide you with the video link & PDF report once confirmed.
*(additional VAT may be added depending on your country of residence. Currently, the US, Canada, Asia have no added VAT but most European countries do)
We’re sure you’ll reap the benefits – don’t forget to contact us with any Elliott Wave questions – Peter is always keen to hear you views, queries and comments.
Visit us @ www.wavetrack.com
Comments
Leave a Reply
