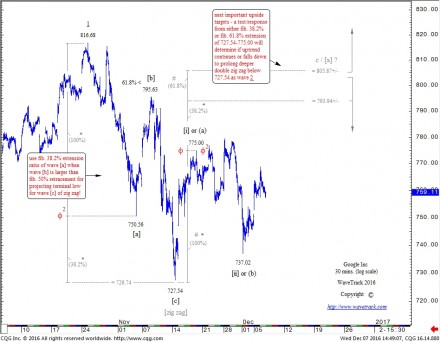
GOOGLE – Fib-Price-Ratio Study
by WaveTrack International| December 7, 2016 | 2 Comments
Check this Out! – Fib-Price-Ratio Study Pinpoints Google low at 727.54
Fibonacci-Price-Ratios (FPR’s) form an integral part of the Elliott Wave process of identifying reversals in major markets. Over the last twenty years, we’ve catalogued and archive several hundred examples of how fib-price-ratios can be used in a systematic way to identify a pattern’s completion and a subsequent change of direction/trend.
Each of R.N. Elliott’s 13 patterns have a short-list of accompanying fib-price-ratios that recur with high frequency. This means applying those fib-price-ratios that are specific to the pattern that is evolving. Using this standard approach requires discipline but it’s definitely worth the effort in learning them.
In this example, we can see that Google Inc. declined from its October 25th high of 816.68 into a simple corrective pattern, specifically, a three wave/price-swing zig zag that subdivides 5-3-5 – see fig #1. Once wave [a] of the zig zag has completed, in this case at 750.56, the standard approach is to extend wave [a] by a fib. 38.2% and 61.8% ratio. The former projects wave [c] declines to 726.74 and the latter to 712.40. Once wave [b] ends its counter-trend correction, in this case to 795.63, one additional fib-price-ratio measurement can be applied – this one, I’m sure you’re familiar with already – using a fib. 100% correlation ratio, measuring the equal length/amplitude of waves [a] and [c] – that would project a terminal low for wave [c] towards 731.21.
But one subtle observation also comes through in the analysis of this zig zag decline – wave [b] was quite a deep retracement, slightly more than a fib. 61.8% ratio. That’s important because when ‘B’ waves extend beyond the fib. 50% retracement level, there is a greater statistical probability that wave [c] declines will halt at the fib. 38.2% extension level of wave [a]. And in Google Inc.’s case, it did, wave [c]’s decline ended right into the fib. 38.2% extension target zone, with an actual low formed at 727.54 – not bad!
Looking ahead, we can apply the same FPR guideline to the following advance from 727.54. The next high unfolded into a typical five wave expanding-impulse pattern, ending at 775.00 on November 18th. This means upside continuity into the future. If we don’t know what the larger Elliott Wave pattern is, then this advance can be either the beginning of a new five wave uptrend or another zig zag, this time, wave [x] within the continuation of a double zig zag decline from 816.68 as minute wave 2. Either way, an upside attempt is consistent for both wave counts/scenarios. And so, extending the initial five wave upswing from 727.54-775.00 by a fib. 38.2% and fib. 61.8% ratio projects two upside objectives to either 793.94+/- or 805.87+/-. These are, of course, minimum upside targets based in the assumption the entire advance from 727.54 is a zig zag pattern, labelled wave [x]. When prices test either of these levels, we’ll check on whether a five wave subdivision is evident in this next advance from 737.02 – if it does subdivide into a five wave pattern then stages price-rejection, we’ll know that it is ending wave [x] and that prices will then begin a secondary zig zag decline that ultimately trades below 727.54.
But should the price action thrust above these levels, it would otherwise indicate Google Inc. has resumed its much larger/aggregate uptrend as minute wave 3.
Get access to WaveTrack’s bi-weekly Elliott Wave Compass report featuring many short-term updates of all 4 asset classes!
Successful trading with WaveTrack International
Subscribe to the EW-Compass here…
Comments
2 Responses to “GOOGLE – Fib-Price-Ratio Study”
Leave a Reply


December 8th, 2016 @ 1:07 am
Thanks for this. As a student of Wave theory posts like this are invaluable to me.
May 31st, 2024 @ 8:55 am
This page really has all the information I needed concerning this subject and didn’t know who to ask.