DJ Transportation Average – The Beginning of a Major Advance
by WaveTrack International| April 22, 2016 | No Comments
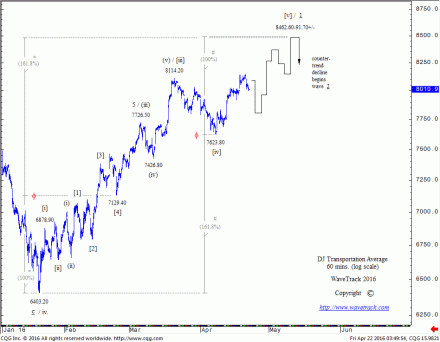
The price declines that began unfolding for the DJ Transportation Average from the November ’14 all-time-high of 9310.20 ended a typical counter-trend zig zag pattern last January at 6403.30. This is labelled as a 4th wave retracement within the upward progress of intermediate wave (3) that began its uptrend from the Oct.’11 low. A 5th wave advance is now engaged to the upside with ultimate targets towards 10876.20+/- derived where it unfolds by a fib. 61.8% ratio of the net advance of the 1st-3rd waves.
It may take another year or so before the 10876.20+/- number is reached with the condition that it subdivides into a five wave expanding-impulse pattern, labelled in minute degree, 1-2-3-4-5.
Minute wave 1 began this uptrend last January from 6403.20 – see fig #1. It too must subdivide into a smaller five wave expanding-impulse pattern (the term ‘expanding-impulse’ is given to five wave patterns that contain ‘price-expansion’ in one of the impulse waves, i.e. 1-3-5 – in other words, one of the waves ‘extends’ so that it measures larger than the other two, commonly occurring in the 3rd wave position – this differentiates it from a ‘diagonal-impulse’ that does not contain the quality of ‘price-expansion’ – a diagonal contains ‘overlap’ because its 3rd wave has not expanded the price action).
The DJ Transportation Average’s upside progress began hesitantly, building into a series of gradual upside movements in a step-like progression associated with a sequence of 1-2-1-2-1-2’s. These are a function of ‘fractalisation’ where a 3rd wave subdivides into smaller degrees of trend prior to ‘price-expansion’. This is evident in the DJTA upswing until a 3rd-of-3rd-of-3rd wave advance began mid-February. The conclusion of price-expansion as this third wave ended on the 17th February at 7383.10. The series of 1-2’s, three of them in total must ultimately be followed by an equal amount of 4-5’s, i.e. 4-5-4-5-4-5. Two 4-5’s have so far completed, a third 4th wave as minuette wave [iv] into the early-April low at 7623.80. This leaves just one final 5th wave advance, as minuette wave [v] to develop higher.
A final upside target is measured towards the 8462.60+/- to 8491.70+/- levels. These are derived from two ‘golden-section’ measurements of the entire impulse pattern from the Jan. ’16 low. The point where price-expansion began at 7129.40 is extended from the Jan.’16 low by a fib. 161.8% ratio that projects to 8462.60+/-. Also, extending minuette waves [i]-[iv] by a fib. 61.8% ratio projects to 8491.70+/-.
So these become the main target levels for the completion of this impulse pattern. Naturally, a counter-trend decline will then begin a larger 2nd wave pullback. It will be interesting to see how deep that one evolves!
Stay up-to-date!
Institutions – contact us for access to the EW-Forecast database where over 200 forecasts are illustrated with market commentary including all time-series for all global indices.
Private-Clients – subscribe to the Elliott Wave Compass report for bi-weekly updates for stock indices, currencies, bonds and commodities
Comments
Leave a Reply

