S&P 500 – Golden Ratio at 2062.00
by WaveTrack International| August 10, 2015 | No Comments
Much debate continues over the S&P’s course and direction with mainstream Elliott Wave analysts and bloggers hedging bets with various ‘alternate counts’ – so many in fact that it becomes a real head-spin!
But there are clues that provide a more realistic probability in favour of continued upside progress. But to see this, you have to leave behind certain U.S.-centric perceptions derived solely from staring at the S&P or Dow Jones futures every day. Instead, scan across the global scene of major indices and select a proxy index that’s unfolding into a reliable Elliott Wave pattern – one that can be easily identified. We’ve been doing this for entire year so far and it’s maintained an overall bullish outlook with Europe’s Eurostoxx 50 leading the way.
S&P 500 Golden-Ratio at 2062.00
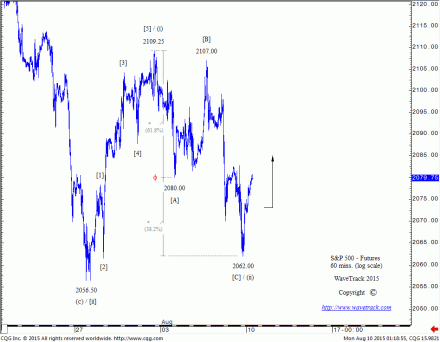
But during last week’s sell-off, even the S&P was clarifying the bullish intent for the markets to resume higher – see chart. The late July advance unfolded into a clearly defined five wave expanding-impulse pattern, beginning from 2056.50 and ending at 2109.25. This was followed by a deep counter-trend correction labelled [A]-[B]-[C].
Fibonacci-Price-Ratios (FPR) provide valuable clues in identifying the progress of a pattern, allowing differentiation when deciphering what pattern is unfolding whilst having the ability to eliminate other alternate counts. In this latest example that I’d like to share with you, the most common of FPR’s, the ratio 61.8% or ‘golden-ratio’ phi measurement is used to project the completion of the counter-trend decline.
Extending wave [A] x 61.8% = [C] at 2062.00 – this was the exact low traded last Friday evening.
The following upswing towards the 2080.00+/- level is enough to qualify a ‘reversal-signature’ – so from this action of pattern and ratio, we can surmise that the S&P is preparing to resume its uptrend.
Comments
Leave a Reply


