Elliott Wave pattern of the month (US$ / Yen)
by m.tamosauskas| July 29, 2015 | No Comments
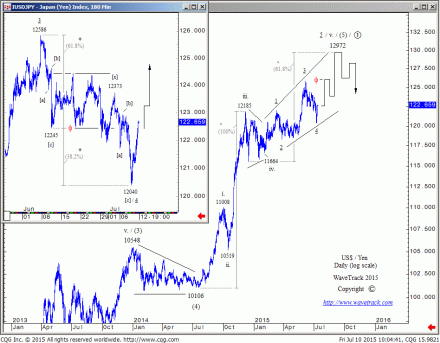
This month, we throw a glimpse on the US$/Yen. From the June high of 125.86, we saw a strong sell-off to a low of 122.45. This decline unfolded into three price swings and was therefore labelled as an [a]-[b]-[c] zig zag sequence. The subsequent price action however failed to trade higher and instead remained in a trading range of about 122.50 to 124.50.
In July, prices broke lower until they came to a halt at 120.40. For somebody not acquainted with Elliott Wave, this could have looked like the beginning of a much larger decline. But the Elliott Wave Principle, combined with our proprietary fib-price-ratio measurements for each individual pattern, provided a valuable clue.
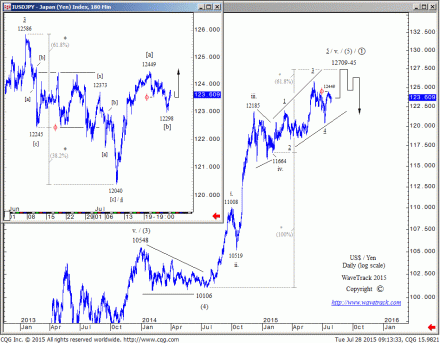
First, a fib. 61.8% extension of the initial 125.86-122.45 decline exactly pinpointed the 120.40 low. This was the strongest evidence for the conclusion of the entire pattern from 125.86. But what kind of pattern? When we examine the structure, we see a similarity between the initial decline and the sell-off from 123.73 into the final low – both unfolded into 5-3-5 single zig zag sequences. This was the second clue that pointed to the conclusion that the US$/Yen had just completed a double zig zag pattern. This also explained the multi-week trading range that could now be labelled as wave [x] and classified as a running flat sequence.
Subsequent price action verified this count as the US$/Yen quickly continued higher and soon broke above the interim high of 123.73 high – a strong bullish signal.
Comments
Leave a Reply


