Can 3’s end a 5 wave pattern?
by m.tamosauskas| April 11, 2014 | No Comments
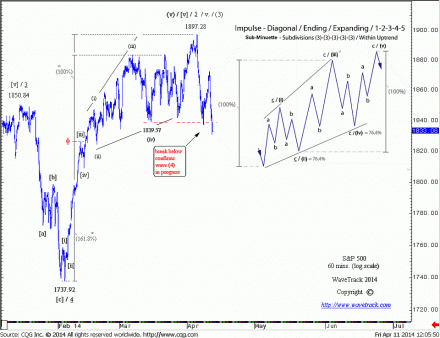
The S&P 500 has been approaching an important high during the last few weeks as its five wave impulse advance beginning from the June ’12 low of 1266.74 nears the completion for intermediate wave (3). This is affirmed where minor wave i. one of (3) is extended by a fib. 161.8% ratio to project minor wave v. five of (3) to a high at 1885.26.
Minor wave v. five began a final upswing from the June ’13 low of 1560.33 and this subdivides into a smaller five wave expanding-impulse pattern, 1–2–3–4–5. Minute wave 5 five began its final advance from the early-Feb.’14 low of 1737.92 – see chart. But when subdividing this into a smaller five wave sequence, there is one visible stand-out – the final advance from the mid-March low of 1839.57 unfolded into a three wave sequence, a zig zag. How can a mature uptrend finalise into a three wave pattern, when ordinarily, a five is required?
This three wave sequence has certainly muddled the picture and eluded the casual Elliott Wave practitioner’s eye – but look closely, and the answer can be found.
Following last Friday’s ‘key-reversal-signature’ (April 4th) and now Thursday’s break (April 10th) below key support levels at 1839.57, there is no doubt that the 1897.28 high ended the 21 month advance as wave (3) – but what about that three wave sequence into the high?
The fifth wave of the Feb.’14 advance has taken the form of an ending expanding-diagonal pattern. Composed of five price-swings, each of its ‘impulse’ sequences, waves (i)-(iii)-(v) commonly subdivide into three price-swing patterns, zig zags (or multiples, doubles/triples). The finalising advance as wave (v) from the 1839.57 level can be clearly seen unfolding higher into a zig zag to the 1897.28 high – this explains why the overall advance has ended into a ‘three’ wave sequence, not a usual ‘five’ – see inset tutorial chart, top-right for comparison.
Comments
Leave a Reply

