Yield Inversion Coming to an End
by WaveTrack International| March 27, 2019 | No Comments
Fixed Income Service – US3mth Eurodollar-US10yr Yield Spread
Rising expectations of a global recession have resurfaced over the last week. Especially, since the US$ dollar yield curve inverts for the first time since Dec.’07. Back then, the inversion actually began in Oct.’7. Just two months before the stock market peak of Oct.’07 that began the financial-crisis sell-off.
Investor’s perception is that an interest rate inversion precedes a global recession. Although, in a recent research note from Canaccord Genuity wealth management, it says there’s a time lag between the two events. It quotes ‘even if the yield curve inverts…over the past seven economic cycles, the median S&P 500 gain from the initial inversion to ‘the’ cycle peak is 21% per cent, with a recession a median 19 months after the initial inversion. If you look at the previous three most similar cycles, the S&P 500 gains to peak rises to 34% and recession is 25 months later’.
Obviously, there’s a distinct difference between the performance of the S&P 500 and what qualifies as a recession following a yield curve inversion. We know that recessions follow the price action. However, more often lagging by several months. That was certainly the case during the financial-crisis sell-off.
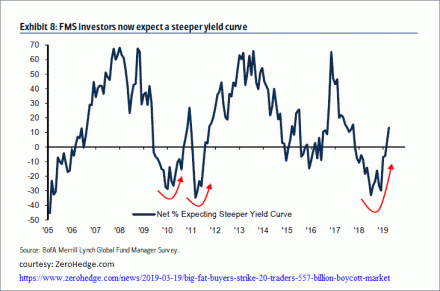
One of the interesting statistics from the latest Bank of America/Merrill Lynch survey was that fund managers economic growth expectations was actually improving, not worsening over the last month – see fig #1 [courtesy of ZeroHedge.com]. It states ‘growth expectations rebounding…net 25% of FMS investors expect global growth to weaken over the next 12 months, up 22ppt (percentage points) MoM and 36ppt from the low of 60% in January ’19 (which was consistent with 2000/01 & 2008/09 recessions), despite biggest 2-month improvement since Dec.’16 growth expectations still remain v (sic. very) vs. FMS history’.
Yield Inversion Coming to an End
We wonder if lowered expectations of a recession are because the S&P 500 has just traded to a new post-December ’18 high (2866.00)? Most probably, in which case, with the onset of a steep corrective downswing which is forecast developing over the next few months, at least from an Elliott Wave perspective [wavetrack.com], these expectations will most likely rise again, heading back to January’s figure of 60% per cent.
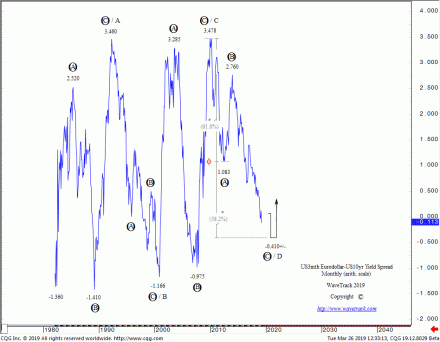
The long-term chart of the US 3mth Eurodollar-US10yr Yield Spread is fascinating to see – fig #2. It depicts a constant range-trade between +3.478 and -1.410 since the early-1980’s. This covers the period of the yield inflation-peak of January 1981 through to the major lows of years-2012/16. Each major upswing/downswing are labelled unfolding into primary degree zig zags. These are probably part of a multi-decennial triangle pattern, A-B-C-D-E.
The narrowing phase which began wave D’s downswing from the Dec.’09 high of 3.478 has since unfolded into a primary degree zig zag. Labelled as A-B-C where wave A ended an initial decline at 1.083 in July ’12. Using WaveTrack International’s proprietary technique of measuring a zig zag pattern, wave A is extended by a fib. 61.8% ratio to project a terminal low for wave C towards -0.410+/-.
Conclusion
With current levels trading around -0.113, it seems that we’ll not have too long to wait! Soon the validity of -0.410+/- in determining the end of the zig zag and the beginning of a new widening/steepening cycle will be tested. And whether that translates into an S&P 500 downturn sometime into the future is another interesting question.
Find out what WaveTrack’s latest US 10yr Yields forecast is subscribe to the EW-Compass report.
Comments
Leave a Reply


