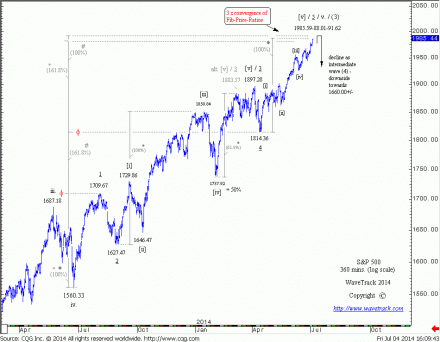
Triple fib-price-ratio convergence
by m.tamosauskas| August 1, 2014 | No Comments
Back in early July, we presented a triple fib-price-ratio convergence level that proved to be a rock solid resistance. The S&P 500 index was trying to reattempt these highs several times but finally gave up and the result of all of that is a free fall decline.
Yesterday we published an interim report to all our EW-Compass subscribers stating:’ Despite yesterday’s impressive Q2 U.S. GDP figures and the latest comments from the Federal Reserve that it would maintain a highly accommodative policy stance for a considerable period after expiry of the bond-purchase programme, we see the S&P 500 breaking integral support levels below 1952.86 during the opening of today’s session. This suggests a final top is in for intermediate wave (3), ending this advance that dates back to the June ’12 low 1266.74.
Up until today’s action, there was always a chance of the S&P extending into one additional higher high as last night’s short-term update described, but the break below the early-July low of 1952.86 was significant – furthermore the pattern from the 1991.39 high displays an incomplete five wave impulse pattern in downside progress – this also negates the alternate short-term count scenario describing an expanding flat pattern that would allow one additional higher high to develop.’
As we have turned down, the fib-price-ratios will be extremely valuable tool to determine possible support levels and ending point for counter-trend advances. Become an EW-Compass report subscriber and get shorter-term insights to other stock market indices. The latest report will be published later tonight.
Comments
Leave a Reply

