SP500 EuroStoxx Dax – Upside Levels Are Being Tested Now
by WaveTrack International| June 4, 2018 | 1 Comment
SP500 – Interim Upside Resistance Levels Are Being Tested Now!
Overall uptrends that began from the late-March/early-April lows remain on-course. However, shorter-term, interim upside resistance levels are being tested for the S&P 500, Eurostoxx 50 and Xetra Dax indices. These resistance levels were quoted in last Friday’s detailed report. Nevertheless, there is an increasing risk that price-rejection will confirm a temporary retracement decline unfolding over the next week or two.
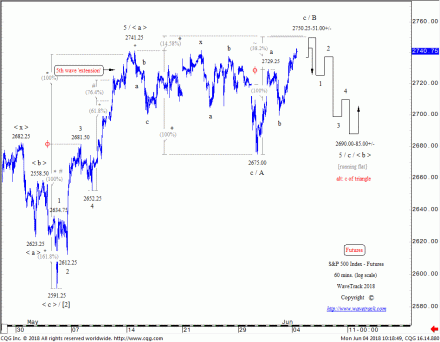
The reason for this is because the SP500 has so far, unfolded higher from the recent low of 2675.00 as a three wave zig zag to current levels of 2744.25 – see fig #1. This means it is prolonging wave < b > as either a running flat or a triangle pattern. This would allow a decline from between 2744.25-2751.00+/- to test downside levels towards 2690.00-85.00+/- before the larger uptrend resumes as wave < c >.
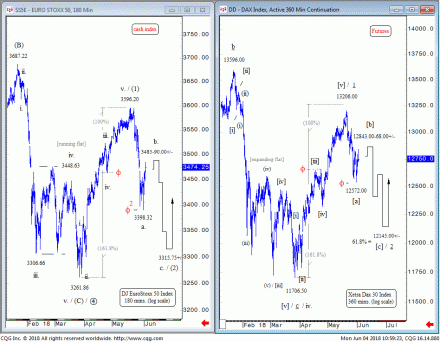
A short-term downswing for the SP500 would corroborate last Friday’s forecast for another downswing for the Eurostoxx 50 and Xetra Dax indices – see fig #2. The mid-May peaks ended 1st waves within prevailing uptrends – the following declines have since begun a three wave zig zag corrective pattern for 2nd waves, a-b-c labelled in minor degree for the Eurostoxx 50 (see left) and in minuette degree for the Xetra Dax (see right). Both have completed upside targets for wave ‘b’ today, opening downside risk for wave ‘c’ declines – towards 3315.75+/- for the Eurostoxx 50 and 12145.00+/- for the Xetra Dax.
Conclusion
Larger uptrends remain bullish but this short-term analysis indicates a temporary pause, a corrective downswing prior to a resumption higher later.
Are you trading the SPX 500, EuroStoxx, Nasdaq 100, Russell 2000, Dow Jones 30, Dax, FTSE100 or ASX200? Don’t miss WaveTrack’s regular updates in our bi-weekly EW-Compass Report! Ensure you’re tracking our Forex forecasts – subscribe online for the EW-COMPASS REPORT.
Visit us @ www.wavetrack.com and subsribe to our latest EW-COMPASS report!
Comments
One Response to “SP500 EuroStoxx Dax – Upside Levels Are Being Tested Now”
Leave a Reply


June 7th, 2018 @ 2:18 am
A few posts lower explaining in special EW tutorial why it is wave X(expanded flat of course) for Eurostoxx 50 and talking about consistency.
Now it is relabeled as wave 1…. I love your consistency:)))