SP500 + Nasdaq 100 = Bullish!
by WaveTrack International| December 10, 2018 | 1 Comment
SP500 and Nasdaq 100 holding above Oct/Nov. lows – Bullish!
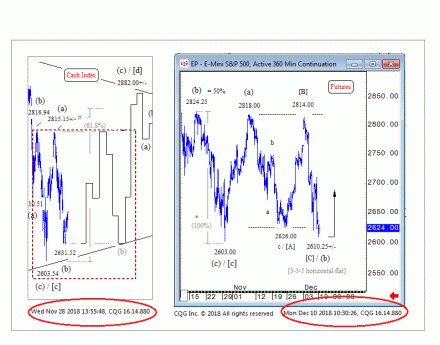
The SP500 has traded initially lower from Friday’s closing session but is now responding to support at 2610.25+/-. Only a fraction below the late-November low of 2626.00 but above the all-important late-October low of 2603.00.
In fact, the recent decline from 2814.00 is consistent with completing a horizontal flat pattern. This was the original concept featured in the November 28th report – see fig #1. The idea behind this scenario when, at the time, the SP500 was just turning higher from 2626.00 was that it would re-test towards the previous high at 2818.00 (2815.50 cash index). Afterward decline in a five-wave pattern back towards 2626.00+/- to complete wave (b) – see red-boxed rectangle, left.
Those price movements have now been accomplished basis today’s decline to 2610.25+/-.
In the November 28th report, we commented that a horizontal flat pattern was possible for wave (b) because it would CONSUME MORE TIME, allowing the next upswing as wave (c) to test the upper/declining boundary line of the developing triangle pattern. That seems to be confirmed from this latest price action. Upside targets as before, towards 2855.00-82.00+/-.
Conclusion
The markets are portraying all the characteristics of nervousness, anxiety and distress which commonly occurs at ‘price-extremes’. In this case, at an important low. The dollar interest rate yield-curve inversion at the US02-05yr term and trade tariff concerns are playing their part – but if Elliott Wave analysis has anything to say, then markets are still building an important platform of support which leads to higher-highs over the coming weeks and months ahead.
Furthermore, the latest update on the SP500 and Nasdaq 100 can be found in WaveTrack bi-weekly EW-Compass report on the STLG/USD, EUR/USD, US Dollar Index, Bitcoin, US Dollar Index, Crude Oil, EuroStoxx, Russell 2000, Dow Jones 30, Dax, ASX200 and more! Don’t miss WaveTrack’s regular updates in our bi-weekly EW-Compass Report! Ensure you’re tracking our Forex forecasts – subscribe online for the EW-COMPASS REPORT.
Visit us @ www.wavetrack.com and subsribe to our latest EW-COMPASS report!
Comments
One Response to “SP500 + Nasdaq 100 = Bullish!”
Leave a Reply


December 17th, 2018 @ 10:34 am
Nice try, but the wrong pattern again.
You did not want to listen a year ago, because you are such a “great market wizard”…. Curios now did you tell your subscribers that your “unique pattern” is wrong, and to throw it into the dustbin where it belongs? Did you admit you are wrong or still too much ego?
Usually I do not care about “experts” which do not want to listen, but so much arrogance…. “the great EW expert”. Quick look at your free blog to lure the sheeple will show mediocre forecasts not even close to expert.
The second leg lower is already running. Higher for Christmas(no 2850) and lower again. The flat finished when I wrote the last time. From the top we have a zig-zag, no impulses, no bullshit expanded flat, no running flat.
Bonus for those who wasted their money for EW compass or whatever its called – PM there is no inflation pop, commodities are in secular bear market until 2030.