SP500 – Heading Lower
by WaveTrack International| April 28, 2020 | No Comments
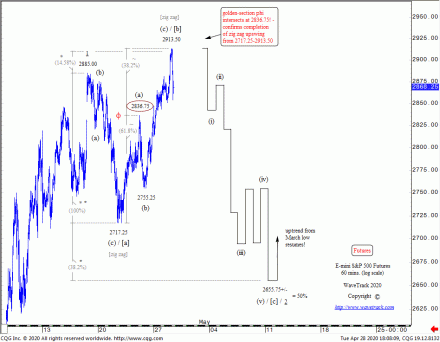
SP500 – Expanding Flat – Heading Lower Towards 2655.75+/-

SP500 E-mini Futures – 60 mins. – Elliott Wave Forecast by www.wavetrack.com – WaveTrack International
The SP500 has just completed a three wave zig zag rally from last week’s low of 2717.25 into today’s high of 2913.50. This pattern is labelled in sub-minuette degree, (a)-(b)-(c). Note how extending wave (a) by a fib. 61.8% ratio projects the terminal high for wave (c) smack into the actual high of 2913.50, validating its completion.
The 2913.50 high ends a larger degree [b] wave advance within a declining [a]-[b]-[c] expanding flat pattern. By extending wave [a]’s initial decline to 2717.25 by a fib. 14.58% ratio projects a terminal high towards 2910.25, just a slither away from the high.
Wave [a] can also be extended to the downside by fib-price-ratios in determining the terminal low for wave [c]’s five wave impulse downswing. We’ve selected a fib. 38.2% ratio because this converges with the fib. 50% retracement level of the preceding impulse advance of minute wave 1 that began from the April 2nd low of 2424.75 (log scale). This projects wave [c] towards 2655.75+/-.
Conclusion
Identifying this expanding flat pattern verifies the larger advance from the March 23rd low of 2174.00 is a bullish 1-2-1 sequence with another 2nd wave correction underway towards 2655.75+/-.
This disproves the theory that March’s advance is a corrective zig zag within a secular-bear downtrend. Rather, it proofs the bullish outlook of the secular-bull uptrend of intermediate wave (5).
If you’d like to see more charts like this, please subscribe to our latest video update – more information here:
SPECIAL VIDEO – Aftermath of the Coronavirus Sell-off – Inflation-Pop Diluted but Still On-Track
Get WaveTrack’s latest SP500 forecasts by subscribing to the Elliott Wave Compass report.
The ELLIOTT WAVE COMPASS report focuses on the shorter-term perspective of price development. Firstly, the report is comprised of two online updates per week. Secondly, it is describing and illustrating a cross-section of market trends/counter-trends for stock indices, bonds, currencies, and commodities from around the world. And above all, this report is ideal for professional and private clients trading a time horizon of just a few days to a few weeks ahead.
The bi-weekly EW-Compass report offers a short-term perspective for global markets
· Stock Indices
· Bonds
· Currencies (FX)
· Commodities
If you like to know more details about the Elliott Wave Compass report click here, please click here
Comments
Leave a Reply
