SP500 Update – Impulse Patterns Ending Now!
by WaveTrack International| May 15, 2018 | No Comments
SP500 Update

SP500 – Futures vs. Nasdaq 100 – Futures – 60 mins. Elliott Wave Forecast by WaveTrack International
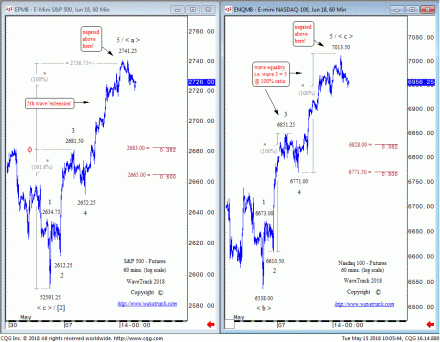
Last week’s update forecast the upside completion of the SP500’s impulse pattern towards 2708.75+/- where the 5th wave unfolds by a common fib. 61.8% ratio of the 1st-3rd wave advance. But the SP500 pushed even higher, to an extent at which it developed as a 5th wave ‘extension’, where the 5th wave measures greater than either the 1st or 3rd wave sequence (see fig #1, left). The final high ended at 2741.25. This is an uncommon recurrence of only 5-7% per cent and it usually manifests at times of intense short-covering.
Sentiment in the lead-up to this advance was predominantly bearish. Especially, because the preceding advance during April unfolded into a discernible corrective/counter-trend pattern. And for investors/traders that weren’t familiar with this pattern, bearishness prevailed in previous polls simply because of the impact on rising interest rates. But the April 18th high was exceeded last week, causing the ‘extension’ in a flurry of hectic buying.
By comparison, the Nasdaq 100’s equivalent advance from the early-May low ‘looks’ more like a conventional five wave ‘expanding-impulse’ pattern where the 3rd wave is commonly the largest sequence, around 85% per cent probability (see fig #1, right). But looking closer, the 5th wave sequence is actually the same amplitude as the 3rd wave, they measure equally at a fib. 100% equality ratio. That in itself is an uncommon event. The high at 7013.50 was just a shave shorter than the 3rd, but technically, we would say these are equal.
SP500 and the latest Corrections
A short-term correction/counter-trend decline can be expected to unfold over the next several trading days. The fib. 38.2% and fib. 50% retracement areas are prime candidates to aim for, although they could be deeper. Once an initial downswing has unfolded, the pattern can be examined to determine the completion of the correction in its entirety. But until that happens, these two downside levels become the provisional downside target levels. Both adhere to Elliott’s guideline of a return to ‘fourth wave preceding degree’.
Conclusion
These short-term five wave impulse patterns are part of much larger advances underway within April’s uptrend. Once these corrections have completed, both the SP500 and Nasdaq 100 are forecast even higher, for a revisit of the February highs, and in the Nasdaq 100’s specific case, a break to new record highs.
Are you trading the SP500, EuroStoxx, Nasdaq100, Russell 2000, Dow Jones 30, Dax, FTSE100, Shanghai Composite, Hang Seng or ASX200? Don’t miss WaveTrack’s regular updates in our bi-weekly EW-Compass Report! Ensure you’re tracking our Forex forecasts – subscribe online for the EW-COMPASS REPORT.
Visit us @ www.wavetrack.com and subsribe to our latest EW-COMPASS report!
Comments
Leave a Reply
