SP500 – Crisis! What Crisis!
by WaveTrack International| April 15, 2020 | No Comments
The SP500 advance is only three waves up from the March 23rd low – so does this qualify as a corrective a-b-c zig zag within a secular-bear downtrend, or a bullish 1-2-1 sequence within the continuation of the secular-bull uptrend?
The Big Question
Given the amount of correspondence received recently, we’d like to address the one big question that rests upon everyone’s lips. Has February/March’s coronavirus sell-off begun a secular-bear downtrend? Or has the March 23rd low ended a counter-trend correction within the continuation of a secular-bull uptrend?
Our Elliott Wave analysis suggests the March 23rd low ended a correction within the continuation of the secular-bull uptrend. But let’s see if this can really be objectively substantiated.
Mainstream Elliott Wave analysts are saying we’re entering the beginning of a secular-bear downtrend. However, this seems fanciful and not substantiated basis introspective analysis across varying stock indices. Why not take a look at equities or other asset classes?
SP500 – Up or Down?
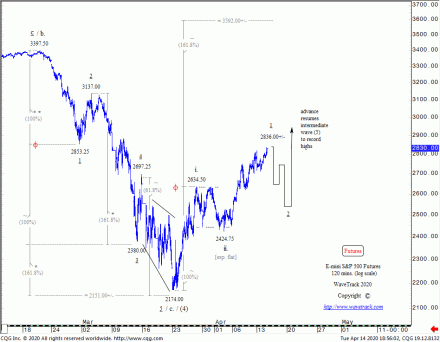
This first chart of the SP500 depicts a five wave impulse downswing from February’s high of 3397.50 ending into the March 23rd low of 2174.00 – see fig #1. This actual low of 2174.00 was forecast on the very day it occurred (see WaveTrack social media updates, twitter and FaceBook dt. March 23rd). See here:
#SP500 – End of Coronavirus Sell-Off – #ElliottWave – https://t.co/GF8fEbEiAq pic.twitter.com/NcBccuHhdU
— Elliott WaveTrack (@ElliottWave_WTI) March 23, 2020
This decline has excited the bears! Mainly, because the next rally has unfolded into a three wave sequence to current levels of 2836.00+/-. But is this an a-b-c corrective zig zag? Or as we suggest, a bullish 1-2-1 sequence?
SP500 and The Larger Picture
Viewed in isolation, both can be equally true! But to answer this truthfully, we must first take a look at how these two sequences, the five wave decline and the three wave rally fit into the larger picture.
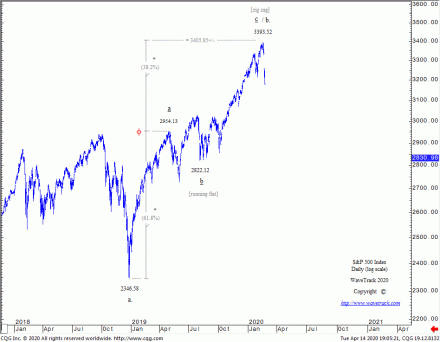
What must be considered is the way the SP500’s advance from the Dec.’18 low of 2346.58 (cash) unfolded into the Feb.’20 high of 3393.52 – see fig #2. In this chart, we can ‘proof’ that it unfolded into an a-b-c zig zag pattern – from a qualitative perspective, both waves a and c subdivide into a necessary five wave impulse sequence – from a quantitative perspective, this advance fits perfectly into the criteria of unfolding into a zig zag, where wave a is extended by a fib. 61.8% ratio in projecting the terminal high for wave c at 3405.85+/- (small deviation).
We already know that secular-bull uptrends don’t finish major highs as zig zags but as five wave impulse patterns. The only time a zig zag can end a secular-bull uptrend in this way is if it were the 5th wave within an ending-diagonal, but this is clearly not the case here.
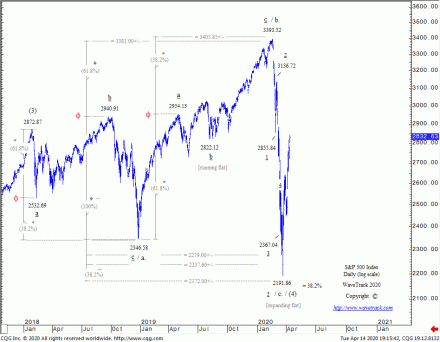
This a-b-c zig zag is in fact, the second sequence, i.e. minor wave b. within a larger a-b-c 3-3-5 expanding flat pattern that began unfolding lower as intermediate wave (4) from the Jan.’18 high of 2872.87 – see fig #3. This explains why February/March’s sell-off to 2196.86 unfolded into a five wave impulse pattern, ending at 21941.86 (cash), 2174.00+/- (futures).
Putting these aspects together, the outlook turns bullish over the next couple of years, not bearish.
But what about the three wave upswing from the March 23rd low? Well, this must be a bullish 1-2-1 sequence – another 2nd wave correction is due, but that should, must end above the secondary low of 2424.75 (futures).
Corroboration – Deutsche Bank – UniCredit Bank
There are many other global indices that support this bullish development – Europe’s Eurostoxx 50 and Xetra Dax, the U.K.’s FTSE-100 are all showing major corrective downswings ended last month. But we’ve also taken a look at the underperforming European Banking Sector to get some idea of which direction the larger trends are developing.
Deutsche Bank
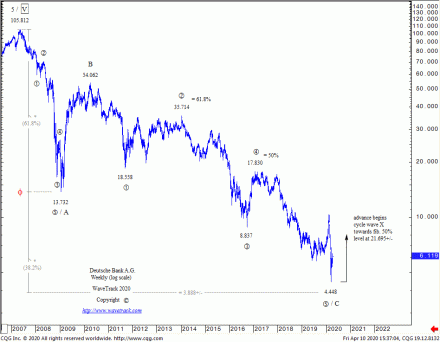
First up is Deutsche Bank. This equity has been underperforming for so long, it’s guaranteed that it will look super-bearish if the SP500 were beginning a secular-bear downtrend. But it’s not! See fig #4. Deutsche Bank is just finishing a major A-B-C zig zag downswing from its all-time high of 105.812 into the March ’20 low of 4.448. We can ‘proof’ this where cycle waves A and C both subdivide into a five wave impulse sequence whilst wave C approaches a terminal low at the fib. 61.8% extension below cycle wave A. Now that’s really bullish. A multi-year rally can begin now. You wouldn’t see that if the SP500 were about to collapse lower!
UniCredit
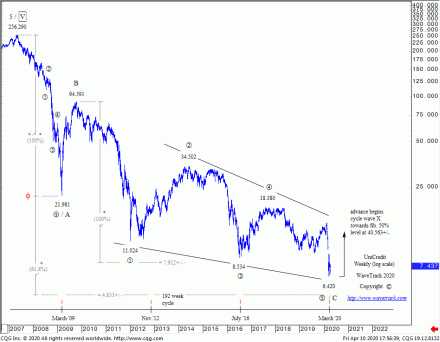
Second, up is UniCredit Bank. It has also declined into a huge A-B-C zig zag corrective pattern from its all-time high of 256.290 ending into the March ’20 low of 6.420! See fig #5. Even more interesting is how cycle wave C’s decline has unfolded, into a five wave ending/contracting-diagonal pattern. Unlike expanding-impulse patterns, the completion of an ending-diagonal pattern has certain finite limits. It can’t ‘extend’ like an expanding-impulse, instead is confined to its narrowing boundary lines. In all probability, it has already ended its concluding 5th wave at 6.420. Now that’s very bullish going forward, and like Deutsche Bank, has the opportunity to begin a multi-year recovery advance – that wouldn’t be the case if the SP500 were about to collapse lower.
Conclusion
There’s no doubt that global economies have been hard hit due to the coronavirus pandemic. Will they recover? Yes, we think they will. It may take longer for Main-Street to pick itself off the ground than Wall-Street. But the omens look good – Crisis! What Crisis!? [Supertramp – circa. 1975].
If you’d like to see more charts like this, please subscribe to our latest video update – more information here:
SPECIAL VIDEO – Aftermath of the Coronavirus Sell-off – Inflation-Pop Diluted but Still On-Track
Get WaveTrack’s latest SP500 forecasts by subscribing to the Elliott Wave Compass report.
The ELLIOTT WAVE COMPASS report focuses on the shorter-term perspective of price development. Firstly, the report is comprised of two online updates per week. Secondly, it is describing and illustrating a cross-section of market trends/counter-trends for stock indices, bonds, currencies, and commodities from around the world. And above all, this report is ideal for professional and private clients trading a time horizon of just a few days to a few weeks ahead.
The bi-weekly EW-Compass report offers a short-term perspective for global markets
· Stock Indices
· Bonds
· Currencies (FX)
· Commodities
If you like to know more details about the Elliott Wave Compass report click here, please click here
Comments
Leave a Reply

