The Silver Wheaton Difference!
by WaveTrack International| September 22, 2016 | 1 Comment

Silver Wheaton – Metals & Mining Update
[THE FOLLOWING IS AN EXTRACT FROM WAVETRACK’S INSTITUTIONAL EQUITY SERVICES]
Many of the silver miners formed simultaneous lows last January (2016) which have since triggered new intermediate & medium-term uptrends. For some, the January lows ended counter-trend zig zag/double zig zag patterns dating back to pre-financial-crisis highs of Nov.’07/April 2008 i.e. Silver Standard Resources, Pan-American Silver Corp. whilst Silver Wheaton Corp. simply ended a smaller counter-trend phase of declines that began from the April ’11 highs. The big difference was that Silver Wheaton Corp. did not break below its financial-crisis low of 2.51 whilst the others did in order to complete their own corrective patterns. This means that Silver Wheaton Corp. is outperforming relative to its 2011 high.
There is scant historical data for these equities which makes intermediate/medium-term forecasting difficult, in terms of precise wave counting but especially true for amplitude measurements. All we do know is that if medium-term Fibonacci-Price-ratios are used for Silver Standard Resources & Pan-American Silver Corp., measuring their initial advances from major lows of August ’98 and April ’01 respectively into those pre-financial-crisis highs, adding these fib. 100% ratios for an equality measurement from the Jan.’16 lows, then upside targets are towards 279.00+/- and 98.50+/-. That’s gains of 7,543% and 1,730%. For Silver Wheaton Corp. a similar fib. 100% equality ratio is used measuring the post-financial-crisis upswing then adding this to the Jan.’16 low of 10.04 to yield targets towards 190.40+/- reflecting potential gains of 1,800% per cent. As historical data is even shorter for Silver Wheaton Corp., such targets could be erroneous. For the time being, we rely on the internal structure of January’s developing five wave impulse advance to determine that a minimum upside target towards 71.00+/- is viable during the next couple of years.
Elliott Wave Case Study
There is still doubt in many quarters of the commodity markets that industrial metals, like silver have begun new uptrends. It was earlier this year when commodity prices extended lower in January/February that mainstream analysts were marking prices heavily down alongside forecasts of incremental U.S. interest rate rises. Neither were realised. Even though some impressive gains have since taken place, sceptics continue to argue the bearish case that rallies are simply counter-trend – that major secular-bear downtrends are in progress. The purpose of examining price declines of Silver Wheaton Corp. during the year-2011/2016 period is an attempt to ‘proof’ this was just a counter-trend sequence within a prevailing uptrend.
Silver Wheaton Corp. – Weekly – Forecast
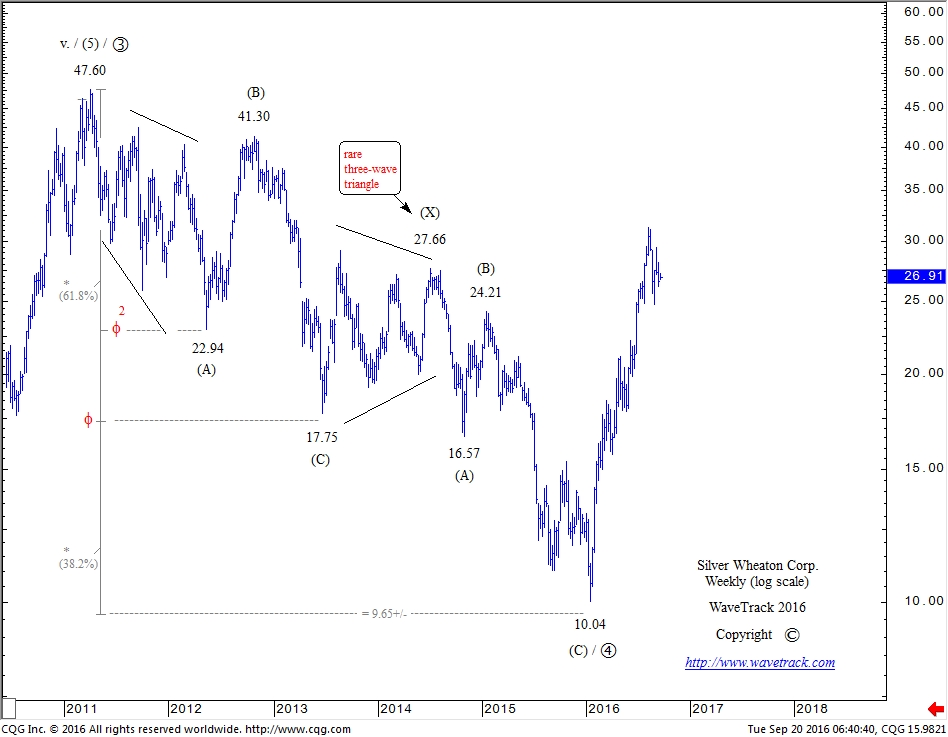
An important high formed in April ’11 at 47.60 – see fig #1. As historical data is limited (begins July ’05), this high represented a new record high which for the purposes of examination, ended primary wave 3 although we can’t be certain. But what is very tangible is the way the subsequent declines have unfolded as primary wave 4 – into a precise Elliott Wave corrective pattern, a seven price-swing double zig zag labelled in intermediate degree, (A)-(B)-(C)-(X)-(A)-(B)-(C).
There are some interesting aspects of this pattern. For example, it began with a leading-expanding-diagonal as wave (A), completing into the May ’12 low at 22.94. This is quite an unusual start for a multi-year decline, but perfectly acceptable. Wave (B) rallies followed, complying with one of R.N. Elliott’s guidelines where retracements head back towards ‘fourth wave preceding degree’, as it did ending at 41.30. Wave (C) declines then got underway, unfolding into a more common five wave ‘expanding-impulse’ pattern defined where its 3rd wave undergoes ‘price-expansion’, eventually ending at 17.75. This is an extension to ‘alternation’ as we know it – so this guideline adopts the concept that if wave (A) unfolds into a ‘diagonal-impulse’ then wave (C) has a tendency to unfold into a more simplistic ‘expanding-impulse’ (and vice-versa).
Now it’s worth noting Fibonacci-Price-Ratio analysis because extending wave (A) by a fib. 38.2% ratio projects the terminal low for wave (C) towards 17.36+/-. The actual low ended just a fraction higher at 17.75 – good enough to verify!
TIP: Why use a fib. 38.2% ratio and not 61.8%? One of the fib-price-ratio guidelines that we’ve documented is this – when wave (B) retraces wave (A) by a fib. 50% ratio or more, then extend wave (A) by a fib. 38.2% ratio to determine the terminal completion of wave (C). If on the other hand, wave (B) ends shorter than a fib. 50%, use 61.8%.
The next observation was something unusual. Intermediate wave (X) unfolded into a three wave triangle, not a conventional five wave sequence. Each of these three price-swings subdivide into 3’s three’s, but the completion at 27.66 leaves behind only a three wave triangle. We’ve documented these in the past and have archived them for reference, but the fact that they can occur is enough to validate one trading guideline that we use daily – never await the completion of a five price-swing triangle to take a trade – always attempt to initiate the trade at the end of the third sequence. Unless this is an expanding triangle, trading wave ‘c’s completion won’t stop you out as wave ‘e’ will normally complete within wave ‘c’s range.
The secondary zig zag pattern began from 27.66 with wave (A) ending at 16.57 – nothing unusual about this except that it ended up being quite a bit shorter than wave (C). Now, to determine a terminal low for the secondary zig zag, the first between 47.60-17.75 must be extended by two ratios – fib. 38.2% and 61.8% projecting downside targets to either 12.18+/- or 9.65+/-. Then, cutting the secondary zig zag from 27.66 by a fib. 61.8% ratio to both downside levels, an interim target for the secondary (A) wave is derived, to either 16.70+/- or 14.40+/-. When wave (A) ended at 16.57, close to the 16.70+/- level it originally heightened the probability of wave (C) eventually ending at 12.18+/-.
When wave (C) did get underway, the internal structure of the pattern did not compete a five wave subdivision into the 12.18+/- level, so this was the first indication that it would eventually extend to the next ‘golden-section’ 0.618 number towards 9.65+/-. The actual low formed at 10.04 but justifying that golden-section ratio with a reversal-signature afterwards. It’s also a good idea to compare Silver Wheaton Corps. pattern with its peers – this often assists in determining a more exact, terminal low.
The rest is history – a new multi-year uptrend has since begun.
For information on WaveTrack’s INSTITUTIONAL EQUITY SERVICES, please contact the HELP-DESK located at the top of our home page www.wavetrack.com or visit WaveTrack’s On-Deman Services page.
Comments
One Response to “The Silver Wheaton Difference!”
Leave a Reply

Recent Posts
Recent Comments
Archives
- June 2025
- March 2025
- February 2025
- January 2025
- December 2024
- August 2024
- July 2024
- June 2024
- May 2024
- April 2024
- February 2024
- January 2024
- December 2023
- August 2023
- July 2023
- June 2023
- March 2023
- February 2023
- January 2023
- December 2022
- November 2022
- October 2022
- August 2022
- July 2022
- June 2022
- May 2022
- March 2022
- February 2022
- January 2022
- December 2021
- August 2021
- July 2021
- June 2021
- March 2021
- February 2021
- January 2021
- December 2020
- November 2020
- August 2020
- July 2020
- June 2020
- May 2020
- April 2020
- March 2020
- February 2020
- January 2020
- December 2019
- October 2019
- September 2019
- July 2019
- June 2019
- May 2019
- April 2019
- March 2019
- February 2019
- January 2019
- December 2018
- November 2018
- September 2018
- August 2018
- July 2018
- June 2018
- May 2018
- April 2018
- March 2018
- February 2018
- January 2018
- December 2017
- November 2017
- October 2017
- September 2017
- August 2017
- July 2017
- June 2017
- May 2017
- March 2017
- February 2017
- January 2017
- December 2016
- November 2016
- October 2016
- September 2016
- August 2016
- July 2016
- June 2016
- May 2016
- April 2016
- March 2016
- February 2016
- January 2016
- December 2015
- November 2015
- October 2015
- September 2015
- August 2015
- July 2015
- June 2015
- May 2015
- April 2015
- March 2015
- February 2015
- January 2015
- December 2014
- November 2014
- October 2014
- September 2014
- August 2014
- July 2014
- June 2014
- May 2014
- April 2014
- March 2014
- February 2014
- January 2014
- December 2013
- November 2013
- October 2013
- September 2013
- August 2013
- July 2013
- June 2013
- May 2013
- April 2013
- March 2013
- February 2013
- January 2013
- December 2012
- November 2012
- October 2012
- September 2012
- August 2012
Categories
- ADXY Index
- Agnico Eagle Mines
- Alcoa
- Amazon
- AngloGold Ashanti
- Antofagasta
- APPL
- Apple
- ASX 200
- AUD vs USD
- AUDNZD
- AUDUSD
- Australia ASX 200
- Baltic Dry Index
- Banking
- Base Metals
- Biotechnology
- Bitcoin
- Bovespa
- Broadcom
- Catalexit
- central banks
- Christmas
- Commodities
- Commodities Video Outlook 2020
- Conference
- Copper
- Coronavirus Sell-Off
- CRB
- Crude oil
- crude oil price chart
- CryptoCurrency
- Currencies
- Currencies + Interest Rates Video Outlook
- Cycles
- Dax 30
- deutsche bank
- Dewey Cycle
- DJ Transportation Average
- DJ Utilities
- Dow Jones 30
- Dow Theory
- ECB
- economy
- Elliott Wave
- Elliott Wave Charts
- Elliott Wave Patterns
- Elliott Wave Principle
- Emerging Markets
- Ending-Diagonal Elliott Wave Pattern
- Equity
- EUR vs CHF
- EUR/USD
- Euro / US$
- Eurostoxx 50
- EuroStoxx50
- EuroStoxxBanks
- EURUSD
- Expanding Flat Pattern
- FAAMG
- FANG+
- fib-price-ratio
- Fibonacci Trading
- Fibonacci-Price-Ratio
- Financial Forecasting
- Fixed Income
- forex
- Freeport McMoran
- FTSE 100
- Fund Management
- FX
- FXStreet
- GBP/AUD
- GBP/USD
- GDX
- GDXJ
- Germany 10 year Euro Bund future
- Gilead Sciences
- Glencore
- Global Economy
- Gold
- Gold Mining
- Golden Ratio
- goldman sachs
- Google Inc.
- Google/Alphabeth
- Greek debt crisis
- Hang Seng
- Harbinger
- Hungarian Forint
- IBEX 35 Index Spain
- Independent Research
- India-CNX Nifty 50
- Interest Rates
- Interview
- IRP Independent Research
- kbw bank index
- Lonmin
- McDonald's
- MID-YEAR VIDEO UPDATE!
- Mifid II
- Mines
- Mining
- MSCI China
- MSCI Emerging Markets
- Nasdaq 100
- Nasdaq Biotechnology Index
- Nasdaq Composite
- Nasdaq100
- Netflix
- Newmont Mining
- Nikkei 225
- NVIDIA
- NYSE Composite Index
- Palladium
- Platinum
- Precious Metals
- Ralph Nelson Elliott
- Reversal-Signature
- Russell 2000
- Russia RTS
- S&P 500
- Sector
- Secular-Bull
- Sentiment Survey
- Shanghai Composite Index
- Silver
- Slanting Flat Elliott Wave Pattern
- SP100
- SP400 Mid-Cap
- SP500
- SPX 500
- STLG/AUD
- Stlg/US$
- STLG/USD
- STLG/YEN
- STLG/ZAR
- Stock Index
- Stock Index Tracking
- Stock Index Video
- Stock Indices
- Stock Indices Video Outlook 2023
- Stock Indices Video Outlook 2025
- Sugar
- Summary
- Tesla
- Tesla Inc
- Toyota
- Track Record
- trading
- Trusts
- Tutorial
- Uncategorized
- UniCredit
- US
- US Dollar Index (DXY) (USDX)
- US$ Index
- US-Dollar Index
- US10yrYields
- USD
- USD/ARS
- USD/CNY
- USD/IDR
- USD/INR
- USD/MXN
- USD/SGD
- USD/THB
- USD/YEN
- USD/ZAR
- Vale
- Value Line Index
- video
- VIDEO OUTLOOK 2018
- VIDEO OUTLOOK 2020
- VIX
- W.D. Gann
- WaveTrack International
- XAU Gold/Silver Index
- Xetra Dax
- XOP
- Yields
- Zig Zag
- Zinc
- ‘INFLATION-POP’
- ‘SHOCK-POP-DROP’
May 31st, 2024 @ 6:13 am
An outstanding share! I’ve just forwarded this onto a friend who has been doing a little research on this. And he actually bought me lunch simply because I found it for him… lol. So allow me to reword this…. Thanks for the meal!! But yeah, thanx for spending some time to discuss this issue here on your website.