How to use the RUSSELL 2000 as a lead indicator?
by WaveTrack International| December 11, 2017 | No Comments
Russell 2000 – NOVEMBER’S IMPULSE PATTERN COMPLETED AT 1560.00! – WATCH FOR BEARISH DIVERGENCE DJIA
Many investors believe the Russell 2000 small-cap index leads the price movements of the large-cap indices like the S&P and Dow Jones (DJIA). However, the reality is that its relationship is often inconsistent. Yes, sometimes it does ‘lead’ but on other occasions, it ‘lags’ too. That doesn’t make it a redundant indicator. It just means that bullish/bearish divergences will occasionally alternate depending on the market forces at the time.
As all major U.S. indices approach important upside targets that end 3rd wave sequences within the five wave impulse pattern developing from the Feb.’16 low. That is why it is especially important to watch for bearish divergences between the small-cap Russell 2000 and the S&P and Dow.
August’s Impulse Completed
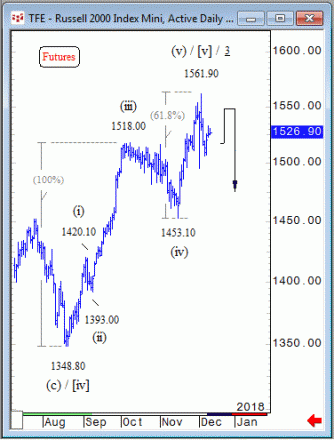
The Russell 2000’s five wave impulse upswing from last August’s low of 1348.80 (futures) represents the fifth wave within the larger 3rd in progress from the June ’16 Brexit low – see fig #1. As you can see from this chart, this fifth wave, labelled as minuette wave [v]. Note how it subdivides into a smaller impulse sequence, (i)-(ii)-(iii)-(iv)-(v). It has structurally satisfied completion already, into the early-December high of 1561.90.
This can be verified using Fib-Price-Ratios – for example, wave (v) unfolds by a commonly recurring fib. 61.8% ratio of waves (i)-(iii) at 1561.90, just 1.3 points from the ‘idealised’ measurement. It has subsequently traded lower to 1506.70, enough to qualify a reversal-signature.
As things stand, the S&P is scheduled to make a bid to a slightly higher-high later this week before it also triggers a ‘reversal-signature’ decline. So it will be interesting to see of some short-term bearish divergence occurs between these two.
Conclusion
Short-term bearish divergence can be misleading but this depends on the Elliott Wave pattern structure. An index could simply be lagging, as the Russell was back in October/November, but now that pattern alignment with the S&P has occurred, any sign of bearish divergence at this juncture becomes much more interesting.
Are you trading the Russell 2000, S&P 500 or Dow Jones? Don’t miss WaveTrack regular updates in our bi-weekly EW-Compass Report! Ensure you’re tracking our forecasts – subscribe online for the EW-COMPASS REPORT.
Visit us @ www.wavetrack.com and subsribe to our latest EW-COMPASS report!
Comments
Leave a Reply

