Presidential Election – TRUMP Win! – Elliott Wave
by WaveTrack International| November 9, 2016 | No Comments
WRONG ELECTION CALL – CORRECT MARKET FORECAST
S&P 500
Donald Trump has just passed through the electoral finishing line ahead of Hilary Clinton to become President elect. That was a surprise outcome given the proximity and location of various stock indices – but the real irony is the fact that the market’s reaction is behaving perfectly in-line with the Elliott Wave forecasts!
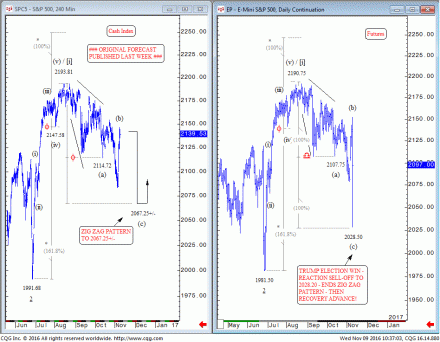
The August decline was labelled as a developing zig zag pattern with downside targets towards 2067.25+/- basis the cash index. The cash index is currently closed having ended last night (Tuesday) at 2139.53. But the futures contract has reacted down to 2028.50 on news that Trump was first to reach 270 electoral votes but in so doing, has ended the zig zag at this lower level, derived not by extending wave (a) of the zig zag by a fib. 61.8% ratio but by a fib. 100% ratio.
The markets have reacted higher since to 2095.00.
What does this tell us about the future direction of the S&P? Firstly, it affirms the assumption that the August decline is a counter-trend within the larger/aggregate uptrend – so that refutes the doom & gloom-ers that cite a secular-bear decline about to begin. Secondly, the counter-trend reaction that has already begun following the trade to 2028.50 is likely to last another few trading days, perhaps ending sometime early next week. This will enable indices like the Biotechnology (NBI) index to complete its own counter-trend upside rally (see Tuesday’s blog).
On another level, a Trump victory seems not to have changed the larger/aggregate picture as described in recent months. The short-term rallies may extend into next week but then fade as the larger, more bearish patterns are still indicating a double-digit percentage decline lies ahead.
This inevitably means adopting the more bearish ‘alternate count’ #2 scenario for the S&P where today’s zig zag completion to 2028.50 is simply the first zig zag in an ongoing double formation. A secondary zig zag decline would eventually pull the index lower over the next few months towards 1934.00+/-. This would align with the double-digit percentage declines we expect from other major indices, notably the Eurostoxx 50 and the Nikkei 225.
More on this subject in tonight’s Market Report
Comments
Leave a Reply

