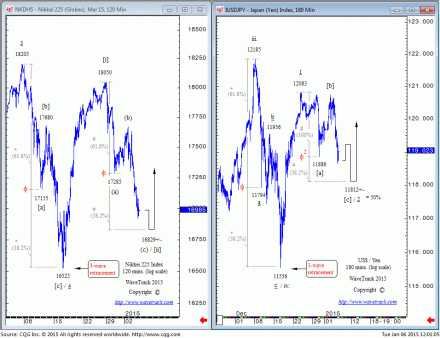
Nikkei-US$/Yen confirms uptrend
by WaveTrack International| January 6, 2015 | No Comments
It’s no secret that there remains a positive correlation between the Nikkei stock index and the US$/Yen currency pair – see chart. But what is interesting at this time, especially when Crude Oil has again made headline news following another decline and U.S. stock markets like the S&P has given up a good proportion of its gains from the mid-December lows of 1972.53 is the fact that both the Nikkei and the US$/Yen are suggesting an uptrend is in progress.
Going back to the initial decline from the early-December highs, the Nikkei (futures) unfolded into a archetypal corrective 3-wave zig zag pattern from 18205 that ended into that mid-Dec.’14 low at 16525. This pattern is verified by using a simple fib-price-ratio measurement – extending wave [a] of the zig zag to 17155 by a fib. 61.8% ratio projects the low for wave [c] at 16525 (see inset chart, left). The extent and pattern of the
next upswing is important for two reasons – first, it has adopted a five wave subdivision (that’s bullish) – second, it breaks the interim high (wave [b] above 17680) of the preceding downswing so as to eliminate a more bearish 1-2-1-2 count from the Dec.’14 high (again, bullish). Next, the more recent decline has unfolded into another 3-wave corrective zig zag pattern that began from 18050 – extending wave (a) by a fib. 61.8% ratio projects downside targets for wave (c) to 16829+/-. This would be the idealised area to complete the correction and set the stage for the next advance to higher highs. Naturally, this bullish scenario would be negated below the mid-Dec.’14 low at 16525.The US$/Yen has unfolded into an almost identical pattern as compared to the Nikkei (see inset chart, right). A 3-wave corrective zig zag decline unfolded from the early-Dec.’14 high of 12185 ending into the mid-Dec.’14 low at 11556. Extending wave a by a fib. 61.8% ratio projects the low for wave c to 11556 – perfectly! A five wave impulse pattern followed, and again trading above the secondary retracement level of 11956 to eliminate a bearish count from the early-Dec.’14 high. The 12083 high ends the 1st wave in an ongoing five wave advance – a 2nd wave retracement has since begun labelled [a]-[b]-[c]. Extending wave [a] by a fib. 38.2% ratio projects wave [c] to 11812+/- (not quite there yet!). This converges with the fib. 50% retracement level to create hardened support. Should levels test this convergence then stage ‘price-rejection’ and then a ‘reversal signature’, then confirmation of a more sustained upswing will be triggered. This bullish outlook will only be negated below the mid-Dec.’14 low at 11556.
We are currently using these contracts as a ‘proxy’ for the other major stock markets, like the S&P to determine if the current decline from the 2093.55 high is also acting out as a 2nd wave corrective decline. If the Nikkei and US$/Yen patterns have anything to say about it, then we should expect to see an end to the current sell-off sometime during this week.
Tags: currency > fx > USD/YEN
Comments
Leave a Reply

