Nasdaq 100 – Downswing Test
by WaveTrack International| December 3, 2019 | No Comments
Nasdaq 100 – Corrective Zig Zag Downswing Test at 8168.25+/-
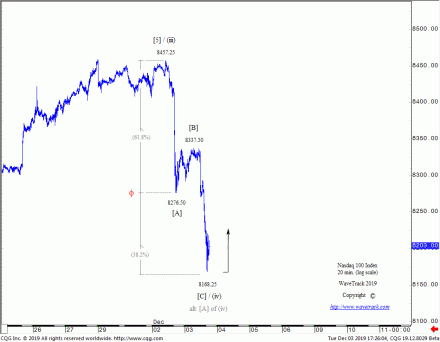
U.S. indices have declined from yesterday’s highs into three wave sequences. Their measurements into the lows traded just a few moments ago fit the profile of a corrective [A]-[B]-[C] zig zag pattern. Therefore, the Nasdaq 100 is a good example of this archetypal pattern but it also applies to the SP500 and Dow Jones futures indices.
The Nasdaq 100 traded lower yesterday, from 8457.25 settling into an overnight low of 8276.50. This can be labelled as ending wave [A] of the zig zag – see fig #1. Wave [B] ended earlier this morning at 8337.50 and [C] a short while ago at 8168.25.
Note that by extending wave [A] by a fib. 61.8% ratio projects the exact terminal low of wave [C] at 8168.25.
But any immediate, accelerative break below 8168.25+/- would negate this bullish outlook. As a result, it would confirm larger declines ahead.
Conclusion
However, should indices hold above the lows seen just a few moments ago and begin to push higher tonight and through tomorrow, it would heighten the probability that this corrective downswing has already completed as sub-minuette wave (iv). We’ll be updating the larger activity/patterns in tomorrow’s EW-Compass report.
Despite the potential for this low in U.S. indices, we still expect larger declines to unfold for the US10yr treasury yields, Emerging Market indices and commodities like Copper and Crude Oil.
WaveTrack’s Elliott Wave Compass report
Get WaveTrack’s latest Nasdaq forecasts by subscribing to the Elliott Wave Compass report.
The ELLIOTT WAVE COMPASS report focuses on the shorter-term perspective of price development. The report is comprised of two online updates per week describing and illustrating a cross-section of market trends/counter-trends for stock indices, bonds, currencies and commodities from around the world. This report is ideal for professional and private clients trading a time horizon of a just a few days to a few weeks ahead.
The bi-weekly EW-Compass report offer short-term perspective for global markets
· Stock Indices
· Bonds
· Currencies (FX)
· Commodities
If you like to know more details about the Elliott Wave Compass report click here, please click here
Comments
Leave a Reply

