Final decline for the CRB-Cash Index (Fibonacci-Price-Ratio [FPR] Tutorial)
by m.tamosauskas| October 25, 2015 | No Comments
Despite some great percentage gains in commodities since prices formed lows last August, the subsequent advances have mostly traded higher into Elliott Wave counter-trend patterns. This is especially evident in the CRB-Cash index. This is a proxy for many of its components including base metals and energy contracts like crude oil, and whilst we expect an imminent completion of the entire declines that began from the year-2011 highs, one additional but final sell-off now seems inevitable.
The examination of this final stage of declines for the CRB-Cash index has also revealed some archetypal Elliott Wave patterning and adherence to Fibonacci-Price-Ratios – it therefore makes an excellent ‘real-time’ study of price development according to two of the Elliott Wave Principle’s (EWP’s) most important aspects, that of ‘structure’ and ‘dimension’.
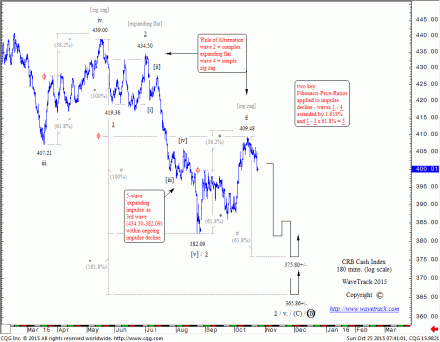
The CRB-Cash index staged a counter-trend upswing from the March ’15 low of 407.21 ending into the May high at 439.00. Its structural composition has unfolded into a typical three price-swing sequence, the definition of an EW zig zag pattern. Furthermore, dimension is evident applying Fib-Price-Ratio studies – extending wave a (ending at the f phi symbol) by a fib. 61.8% ratio projects the high for wave c of the pattern to within a single point of its actual conclusion at 439.00.
The following decline extends the overall five wave impulse decline in progress from the April ’14 high of 569.70. This is labelled a 5th wave, designated minor wave v. five and it must develop with a five wave component labelled 1–2–3–4–5 and assigned in minute degree. Its downward progress has adhered to several typical characteristics of a developing five wave expanding-impulse pattern. First, the ‘rule of alternation’ where waves 2 and 4 differ in their overall structure – wave 2 unfolds into a complex ‘expanding flat’ whilst wave 4 unfolds into a simple ‘zig zag’. Wave 3 visibly ‘expands’ the price action and is much larger than wave 1 – it adheres to Elliott’s concept that third waves are commonly the largest but never the shortest in the pattern. Wave 3 subdivides into a perfectly formed five wave structure ending into the August low at 382.09.
- Wave 4 unfolds into a symmetrically formed three wave zig zag pattern. Extending wave [a] by a fib. 61.8% ratio projects a terminal high for wave [c] to within a point-and-a-half of the actual level traded at 409.48.
- Dimensionally, wave 2 is a fib. 76.4% retracement of wave 1 – wave 4 is a fib. 50% retracement of waves 1–3.
The projection for a final fifth wave decline, labelled minute wave 5 that began from 409.48 is the element where EW Rules & Guidelines are practiced in the real world, real-time. To determine the amplitude of wave 5, two common fib-price-ratios are used. These are selected over-and-above others because of the depth of the fourth wave to 409.48.
- The first is where a Fibonacci ‘extension’ ratio is used measuring waves 1–4 and extending this by fib. 161.8% to project the low for wave 5 to 365.86+/-.
- Second, a Fibonacci ‘correlative’ ratio taking waves 1–3 (= 100%) and multiplying this by a fib. 61.8% ratio for the measurement of wave 5 to 375.80+/-.
And so we can see that from a combination of structure/form and dimension/symmetry, a viable determination of ‘trend’ and ‘amplitude’ can be made. Hope this was helpful, if you enjoined – you can find more EW tutorials in our website.
Comments
Leave a Reply

