1 Common Factor you need to know! EURUSD – USD Index (DXY)
by WaveTrack International| November 27, 2017 | No Comments
EURUSD and US Dollar Index
1 Common Factor = 1 Elliott Wave Pattern
The recent EURUSD revival from the early-November low of 1.1554 seems like it’s resumed the larger uptrend that has been unfolding all year. But a closer look at the pattern structure within its counter-trend zig zag decline from September’s high of 1.2092 tells us otherwise.
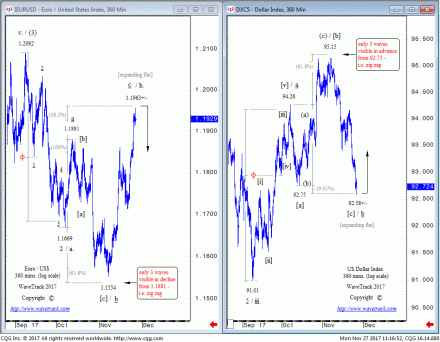
The initial five wave decline to 1.1669 seems obvious enough to end wave [a], but what about the next decline from 1.1881 to 1.1554? Has that also subdivided into a satisfactory five wave pattern as wave [c]? See fig #1 (left).
At the time of the low at 1.1554, we labelled the decline from 1.1881 as completing only a THREE WAVE SEQUENCE, not a five. Besides, the overall decline was too short to complete wave [c] within September’s zig zag pattern – it’s much shorter than wave [a]. Yes, short ‘c’ waves can sometimes occur, about 15% per cent of the time. Yet, that doesn’t explain why wave [c] only unfolded into a three wave sequence.
Expanding Flats
One viable explanation is that minor wave b. within September’s zig zag decline is unfolding into an EXPANDING FLAT, subdividing 3-3-5. That would explain why the decline between 1.1881 to 1.1554 unfolded into only a THREE WAVE SEQUENCE, not a five! Because it ended minute wave b, the second sequence of the expanding flat.
If correct, then the EURUSD’s upswing from 1.1554 as minute wave c of the expanding flat must be coming towards completion right now, at 1.1963+/-. It must also subdivide into a five wave pattern. That is actually possible! In this case it would commonly end above minute wave a’s origin by a fib. 38.2% extension ratio. This is now right into the current level at 1.1957.
All that is needed is a qualifiable ‘reversal-signature’ to take place over the next trading session. A strong push below the previous high at 1.1861 would be enough. In this case this would be the third wave peak within minute wave c ’s impulse advance.
The equivalent expanding flat pattern for the US$ Dollar index can be seen in fig #1, right. It is just testing completion in today’s low at 92.58+/-.
Failure to respond to these targets would negate this forecast, instead confirming 1.1554 and 95.15 ended September’s zig zags, albeit with deficiencies in both pattern and measurement.
Are you trading the EURUSD or the US DOLLAR INDEX? Don’t miss WaveTrack regular updates in our bi-weekly EW-Compass Report! Ensure you’re tracking our forecasts – subscribe online for the EW-COMPASS REPORT.
Visit us @ www.wavetrack.com and subsribe to our latest EW-COMPASS report!
Tags: EUR/USD
Comments
Leave a Reply

