EUR/USD CORRECTION CONFIRMS LARGER UPTREND INTACT
by WaveTrack International| May 31, 2017 | No Comments
GOLDEN-SECTION PHI IN EUR/USD CORRECTION!
There was a noticeable increase in short-covering of G4 currencies against the US$ dollar towards the end of last week (basis the latest IMM positioning reports). The aggregate USD dollar long positioning declined to a new multi-month low at $7.5bn. Meanwhile, the Euro remained the most net-long currency at €9.1bn, a new multi-year high.
When figures like this occur for the Euro, a check on the underlying Elliott Wave pattern progression is useful in determining direction and whether a contrarian bearish stance is appropriate.
The EUR/USD has driven higher since January’s low traded at 1.0341 into last week’s high at 1.1268. No wonder traders have covered shorts in the Euro and are now net long – that’s a huge move.
But is the 1.1268 high the end of this advance, or just part of a new uptrend?
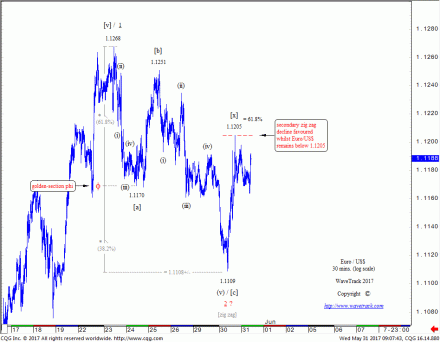
One thing for sure, last week’s decline from 1.1268 has just completed unfolding into a corrective zig zag pattern to 1.1109 – see fig #1. Labelled in minuette degree, [a]-[b]-[c] and subdividing 5-3-5, the zig zag can be ‘proofed’ using fib-price-ratios – for example:
Wave [a] x 61.8% -1.1170 = wave [c] @ 1.1108+/-
The actual low at 1.1109 was only 1 pip deviation! – the fib. 61.8% extension ratio marks the location of the ‘golden-section’ phi
Two observations can be derived from this zig zag. First, it confirms the EUR/USD remains within a larger uptrend despite the current long-positioning extreme revealed in the IMM reports. Second, as the Euro/US$ is somewhat overbought basis the IMM stats, this zig zag could easily neutralise this excess by continuing to decline into a deeper double zig zag pattern, breaking below 1.1109.
To extend the current zig zag into a double pattern, wave [x] resistance must be maintained below the 1.1268 high. And preferably below Tuesday’s high of 1.1205 which happens to be a test to the fib. 61.8% retracement level of the preceding zig zag.
The probability of extending lower, below 1.1109 outweighs a more immediate attempt to higher-highs – but conditional on remaining below nearby resistance.
Learn how to take advantage of WaveTrack’s Fibonacci-Price-Ratios!
Watch WaveTrack’s Fib-Price-Ratio videos on youtube to see how these measurements can be applied. These videos are gems of know-how for those who have eyes to see! WaveTrack’s first Elliott Wave Academy video
Ensure you’re tracking our forecasts – subscribe online for the EW-COMPASS REPORT.
Visit us @ www.wavetrack.com and subsribe to our latest EW-COMPASS report!
Comments
Leave a Reply

