EuroStoxx + Xetra Dax – Can You Spot the EXPANDING FLAT Pattern?
by WaveTrack International| September 27, 2019 | No Comments
Eurostoxx 50 – Xetra Dax 30
Can You Spot the EXPANDING FLAT Pattern?
Wow! – it’s been a really busy summer!! – but very profitable too! Although attention is usually focused on the major U.S. indices like the S&P 500, even if you don’t trade positively-correlated indices from other countries, we always advise analysing them as if you were.
A good example was how two European indices, the Eurostoxx 50 and Xetra Dax 30 played out from May’s highs into August’s lows. Back in May/June, our Elliott Wave Navigator and Elliott Wave Compass reports had identified a corrective pattern unfolding from the May’s highs, as a developing 2nd wave correction. Can you spot what pattern that is? – Yes, an expanding flat!
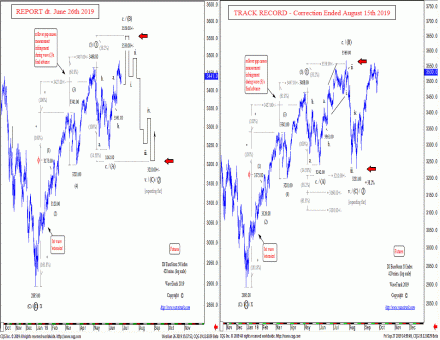
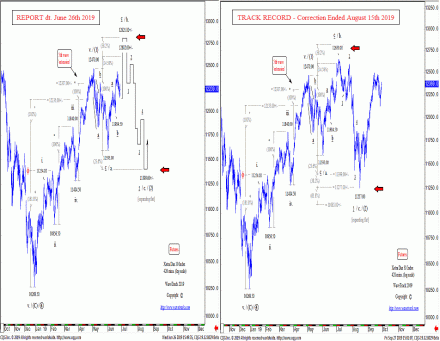
The expanding flat is a three wave sequence, A-B-C subdividing 3-3-5. For the Eurostoxx 50, (A)-(B)-(C) where wave (A) sets the initial price-range – to fulfill the pattern, waves (B) and (C) must marginally complete beyond wave (A)’s range whilst unfolding into a three and five wave sequence. If those conditions, those requirements are met, then the pattern can complete and is validated at predetermined fib-price-ratio levels – see figs #1 & #2.
Basis charts in report/s dt. June 26th, wave (B) upside targets for the Eurostoxx 50 were towards 3530.00+/-, to max. 3559.00+/- then a five wave impulse decline to begin declines as wave (C) towards 3210.00+/-. The actual high for wave (B) was 3569.00 and the low for (C) at 3231.00.
The Xetra Dax had minor wave b. upside targets towards 12602.00+/-, max. 12821.00+/- then a five wave impulse decline to begin declines as wave c. towards 11399.00+/-. The actual high for wave b. was 12650.00 and the low for c. at 11257.00.
Conclusion
The completion of these expanding flat patterns was also replicated in London’s FTSE-100 index. Moreover, it gave validation that other major indices, like the benchmark S&P 500 would also stage a reversal-upswing in August, despite unfolding into a slightly different corrective pattern. This affirms our belief that trading a set of indices should be supported by analysing other related groups too!
Find out what WaveTrack’s latest EuroStoxx and Xetra Dax forecasts are and subscribe to the Elliott Wave Compass report.
The ELLIOTT WAVE COMPASS report focuses on the shorter-term perspective of price development comprising of two online updates per week describing and illustrating a cross-section of market trends/counter-trends for stock indices, bonds, currencies and commodities from around the world. This report is ideal for professional and private clients trading a time horizon of a just a few days to a few weeks ahead.
The bi-weekly EW-Compass report offer short-term perspective for global markets
· Stock Indices
· Bonds
· Currencies (FX)
· Commodities
If you like to know more details about the Elliott Wave Compass report and what contracts are covered please https://www.wavetrack.com/products/elliott-wave-compass.html
Comments
Leave a Reply


