Elliott Wave – The SLANTING FLAT Pattern – GBP/USD
by WaveTrack International| February 9, 2018 | No Comments
R.N. Elliott’s SLANTING FLAT Pattern – GBP/USD
There’s a variation to the corrective ‘FLAT’ pattern that R.N. Elliott documented which causes some confusion in identification. Fortunately, it’s quite rare though. It’s called a SLANTING FLAT. Like the ‘horizontal’, ‘running’ and ‘expanding’ flat’s it subdivides the same, as a 3-3-5 sequence but with some slight differences.
In a horizontal flat, waves A-B-C oscillate within almost-exact horizontal/parallel lines – in an expanding flat, wave A establishes an initial trading range, but waves B and C marginally exceed wave A upon completion – and finally, the running flat where waves A and B conform to the same movements as the expanding flat except that wave C falls short of ending towards the completion of wave A – see fig #1.
Elliott Wave Pattern Highlight The Slanting Flat Pattern
Slanting Flat Pattern
But the ‘SLANTING FLAT’ is a bit of a hybrid of these other patterns. Wave A establishes the trading range-extremity whilst subdividing into a three wave zig zag (can also unfold into a double/triple zig zag). But when wave B begins to unfold, it doesn’t equal or break above the original level of wave A – rather, it falls short. It does subdivide into a three wave zig zag though (can also unfold into a double/triple zig zag). Here’s the interesting bit – the next sequence as wave C unfolds into a five wave impulse pattern and it exceeds the completion of wave A. Sounds simple enough, but here’s the ‘rub’ – how can this be differentiated between a developing double zig zag pattern, i.e. A-B-C-X-A-B-C, 5-3-5-X-5-3-5? The same subdivisions for the ‘slanting flat’occur up until the sequence A-B-C-X-A…waves B-C are missing.
There’s only one certain way to differentiate between a completed ‘slanting flat’ and a developing double zig zag and that’s cross-referencing the pattern with other contracts/markets – there’s a good chance the pattern is unfolding differently but is less ambiguous.
GBP/USD
For what it’s worth, GBP/USD has just completed a real-time ‘SLANTING FLAT’ pattern – see fig #2.
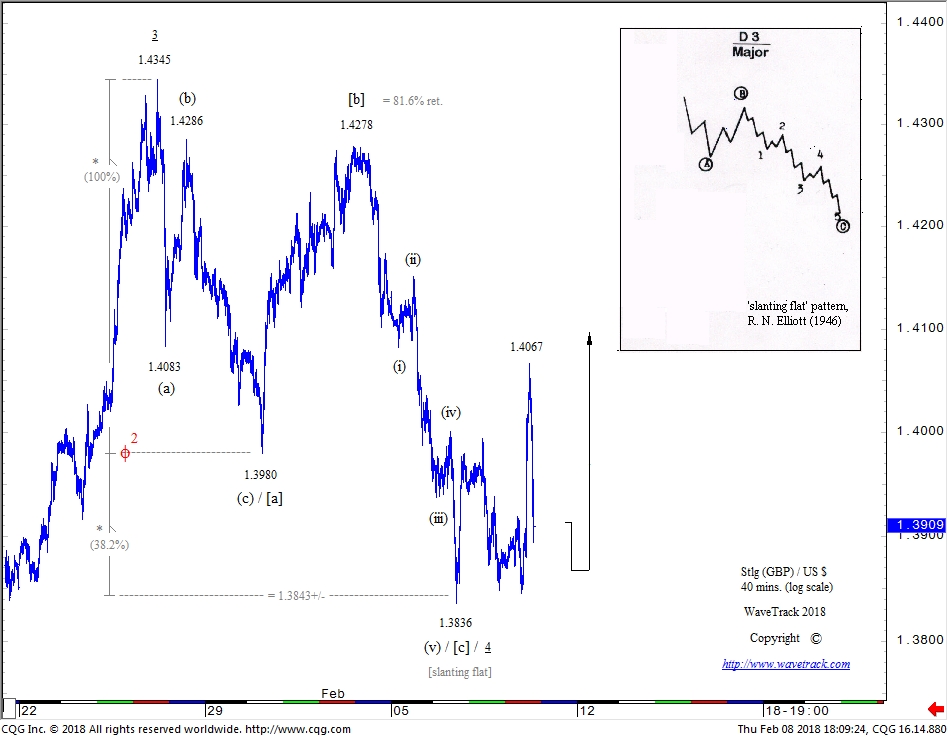
STLG vs USD – 40 mins. Elliott Wave Forecast by WaveTrack International
R.N. Elliott’s original template is inserted top-right. Labelled in minuette degree, [a]-[b]-[c], note that wave [a] subdivides into a required zig zag ending at 1.3980 and how wave [b] doesn’t quite make it to wave [a]’s origin of 1.4345 instead ending short at 1.4278 (a retracement of 81.6%). In reality, the 1.4278 high could have ended wave [x] within a developing double zig zag. The following five wave impulse decline to 1.3836 is labelled as ending wave [c] of the slanting flat but could be mistaken for wave [a] within a secondary zig zag. A comparative look at the Euro/US$ confirms the slanting flat because it has synchronously completed a double zig zag at the same time GBP/USD traded to 1.3836.
Fib-Price-Ratios
Our proprietary use of fib-price-ratios also comes in useful in verifying the completion of a slanting flat rather than a developing double zig zag pattern. Extending wave [a] by a fib. 38.2% ratio projects a terminal low for wave [c] to 1.3843+/-, the actual low was 1.3836.
Conclusion
Yes, it is still possible to conclude the following rally from 1.3836 to 1.4067 in GBP/USD is wave [b] of the secondary zig zag within a double formation but again, analysis must be cross-referenced to other positively-correlated contracts/markets.
Good luck and best wishes,
Peter Goodburn
WaveTrack International
For Currency Traders
Single Video – $48.00* *(additional VAT may be added depending on your country of residence. Currently US, Canada, Asia have no added VAT but most European countries do) – PART II – CURRENCIES (55 charts 2 hours long) (Dec. ’17/Jan. ’18)
Are you trading Currencies – USD, EUR, STLG or AUD? Don’t miss WaveTrack’s regular updates in our bi-weekly EW-Compass Report! Ensure you’re tracking our Forex forecasts – subscribe online for the EW-COMPASS REPORT.
Visit us @ www.wavetrack.com and subsribe to our latest EW-COMPASS report!
Comments
Leave a Reply

Recent Posts
Recent Comments
Archives
- June 2025
- March 2025
- February 2025
- January 2025
- December 2024
- August 2024
- July 2024
- June 2024
- May 2024
- April 2024
- February 2024
- January 2024
- December 2023
- August 2023
- July 2023
- June 2023
- March 2023
- February 2023
- January 2023
- December 2022
- November 2022
- October 2022
- August 2022
- July 2022
- June 2022
- May 2022
- March 2022
- February 2022
- January 2022
- December 2021
- August 2021
- July 2021
- June 2021
- March 2021
- February 2021
- January 2021
- December 2020
- November 2020
- August 2020
- July 2020
- June 2020
- May 2020
- April 2020
- March 2020
- February 2020
- January 2020
- December 2019
- October 2019
- September 2019
- July 2019
- June 2019
- May 2019
- April 2019
- March 2019
- February 2019
- January 2019
- December 2018
- November 2018
- September 2018
- August 2018
- July 2018
- June 2018
- May 2018
- April 2018
- March 2018
- February 2018
- January 2018
- December 2017
- November 2017
- October 2017
- September 2017
- August 2017
- July 2017
- June 2017
- May 2017
- March 2017
- February 2017
- January 2017
- December 2016
- November 2016
- October 2016
- September 2016
- August 2016
- July 2016
- June 2016
- May 2016
- April 2016
- March 2016
- February 2016
- January 2016
- December 2015
- November 2015
- October 2015
- September 2015
- August 2015
- July 2015
- June 2015
- May 2015
- April 2015
- March 2015
- February 2015
- January 2015
- December 2014
- November 2014
- October 2014
- September 2014
- August 2014
- July 2014
- June 2014
- May 2014
- April 2014
- March 2014
- February 2014
- January 2014
- December 2013
- November 2013
- October 2013
- September 2013
- August 2013
- July 2013
- June 2013
- May 2013
- April 2013
- March 2013
- February 2013
- January 2013
- December 2012
- November 2012
- October 2012
- September 2012
- August 2012
Categories
- ADXY Index
- Agnico Eagle Mines
- Alcoa
- Amazon
- AngloGold Ashanti
- Antofagasta
- APPL
- Apple
- ASX 200
- AUD vs USD
- AUDNZD
- AUDUSD
- Australia ASX 200
- Baltic Dry Index
- Banking
- Base Metals
- Biotechnology
- Bitcoin
- Bovespa
- Broadcom
- Catalexit
- central banks
- Christmas
- Commodities
- Commodities Video Outlook 2020
- Conference
- Copper
- Coronavirus Sell-Off
- CRB
- Crude oil
- crude oil price chart
- CryptoCurrency
- Currencies
- Currencies + Interest Rates Video Outlook
- Cycles
- Dax 30
- deutsche bank
- Dewey Cycle
- DJ Transportation Average
- DJ Utilities
- Dow Jones 30
- Dow Theory
- ECB
- economy
- Elliott Wave
- Elliott Wave Charts
- Elliott Wave Patterns
- Elliott Wave Principle
- Emerging Markets
- Ending-Diagonal Elliott Wave Pattern
- Equity
- EUR vs CHF
- EUR/USD
- Euro / US$
- Eurostoxx 50
- EuroStoxx50
- EuroStoxxBanks
- EURUSD
- Expanding Flat Pattern
- FAAMG
- FANG+
- fib-price-ratio
- Fibonacci Trading
- Fibonacci-Price-Ratio
- Financial Forecasting
- Fixed Income
- forex
- Freeport McMoran
- FTSE 100
- Fund Management
- FX
- FXStreet
- GBP/AUD
- GBP/USD
- GDX
- GDXJ
- Germany 10 year Euro Bund future
- Gilead Sciences
- Glencore
- Global Economy
- Gold
- Gold Mining
- Golden Ratio
- goldman sachs
- Google Inc.
- Google/Alphabeth
- Greek debt crisis
- Hang Seng
- Harbinger
- Hungarian Forint
- IBEX 35 Index Spain
- Independent Research
- India-CNX Nifty 50
- Interest Rates
- Interview
- IRP Independent Research
- kbw bank index
- Lonmin
- McDonald's
- MID-YEAR VIDEO UPDATE!
- Mifid II
- Mines
- Mining
- MSCI China
- MSCI Emerging Markets
- Nasdaq 100
- Nasdaq Biotechnology Index
- Nasdaq Composite
- Nasdaq100
- Netflix
- Newmont Mining
- Nikkei 225
- NVIDIA
- NYSE Composite Index
- Palladium
- Platinum
- Precious Metals
- Ralph Nelson Elliott
- Reversal-Signature
- Russell 2000
- Russia RTS
- S&P 500
- Sector
- Secular-Bull
- Sentiment Survey
- Shanghai Composite Index
- Silver
- Slanting Flat Elliott Wave Pattern
- SP100
- SP400 Mid-Cap
- SP500
- SPX 500
- STLG/AUD
- Stlg/US$
- STLG/USD
- STLG/YEN
- STLG/ZAR
- Stock Index
- Stock Index Tracking
- Stock Index Video
- Stock Indices
- Stock Indices Video Outlook 2023
- Stock Indices Video Outlook 2025
- Sugar
- Summary
- Tesla
- Tesla Inc
- Toyota
- Track Record
- trading
- Trusts
- Tutorial
- Uncategorized
- UniCredit
- US
- US Dollar Index (DXY) (USDX)
- US$ Index
- US-Dollar Index
- US10yrYields
- USD
- USD/ARS
- USD/CNY
- USD/IDR
- USD/INR
- USD/MXN
- USD/SGD
- USD/THB
- USD/YEN
- USD/ZAR
- Vale
- Value Line Index
- video
- VIDEO OUTLOOK 2018
- VIDEO OUTLOOK 2020
- VIX
- W.D. Gann
- WaveTrack International
- XAU Gold/Silver Index
- Xetra Dax
- XOP
- Yields
- Zig Zag
- Zinc
- ‘INFLATION-POP’
- ‘SHOCK-POP-DROP’