DOW JONES UTLITY AVERAGE – END OF SECULAR BULL UPTREND?
by WaveTrack International| July 12, 2017 | No Comments
List of Stocks traded in the Dow Jones Utility Average
The Dow Jones Utility Average (DJUA) is a price-weighted average of 15 utility stocks traded in the United States – the current components are as follows:
• AES Corp., (AES) – electric utilities
• American Electric Power Co., Inc. (AEP) – electric utilities
• American Water Works Company, Inc. (AWK) – water utilities
• CenterPoint Energy, Inc. (CNP) – diversified utilities
• Consolidated Edison, Inc. (ED) – electric utilities
• Dominion Resources, Inc. (D) – electric utilities
• Duke Energy Corp. (DUK) – electric utilities
• Edison International (EIX) – electric utilities
• Exelon Corp. (EXC) – diversified utilities
• FirstEnergy Corp. (FE) – electric utilities
• NextEra Energy Inc. (NEE) – electric utilities
• NiSource, Inc. (NI) – diversified utilities
• PG&E Corp. (PCG) – electric utilities
• Public Service Enterprise Group, Inc. (PEG) – diversified utilities
• Southern Company, Inc. (SO) – electric utilities
Dow Jones History
The Dow Jones UA began trading on the 2nd January 1929 at a level of 85.64 when utility stocks were removed from the Dow Jones Industrial Average (DJIA). An interesting point of early history was that during the Great Depression collapse between 1929-1932, the DJUA underperformed the recovery that began in the Dow Jones Industrial Average (DJIA) from 1932 onwards – in fact, it traded to an historical lower-low in March 1942 at 11.40. So this date is the starting point for its secular-bull uptrend.
Dow Jones UA a ‘defensive player’
In the modern era, the DJUA is considered to be a ‘defensive play’ for portfolio managers. For example, in the first four months of 2016, the Dow Jones Utility Average was up 13.3% per cent versus a 1.0% per cent gain for the S&P 500 index – pretty good performance although allowance is given to the S&P as it declined sharply during January by -9.93% per cent so took another 2-months to recover. But you get the point. Usually, in secular-bull uptrends, the main outperformance comes from technology stocks which has recently been evident by the last 18-month performance of the Nasdaq 100. But Utility stocks are worth watching, especially at times of financial stress.
Using the DJUA as a ‘defensive play’ isn’t always a good idea though – the long-term uptrend from the year-1946 low proves that, in other words, it is not 100% negatively correlated but it can limit losses in a portfolio relative to the DJIA or the S&P when a portfolio manager MUST BE INVESTED IN THE MARKET pretty much all the time, with only an cash-fund allowance of perhaps 5-7% per cent.
Current Academic Forecasts for the Dow Jones UA
We already know that certain academics are forecasting a more immediate end to the secular-bull uptrend for the DJIA and the S&P 500, Nasdaq 100 etc. based upon cyclically adjusted price/earnings ratio, or CAPE, made famous by Yale University finance professor and Nobel laureate Robert Shiller. The CAPE is currently near an historical peak which reads the most bearish for the stock market than at any other time since year-1880 with only two exceptions – right before the 1929 stock market crash and in the months prior to the bursting of the internet bubble in year-2000. Can the current set-up be proven from taking a look at the Dow Jones Utility Average (DJUA) from an Elliott Wave perspective?
Elliott Wave Insight
No, the Elliott Wave Principle suggests there will be more upside potential before the DJUA signals an end to the secular-bull uptrend for the DJIA, S&P 500 and Nasdaq100 – see fig #1. From an orthodox Elliott Wave standpoint though, the secular-bull uptrend for the DJUA ended already in November 2000 at 418.30 with the following decline/advance to current levels unfolding as the first two sequences of a multi-decennial EXPANDING FLAT pattern, i.e. A-B-C subdividing 3-3-5.
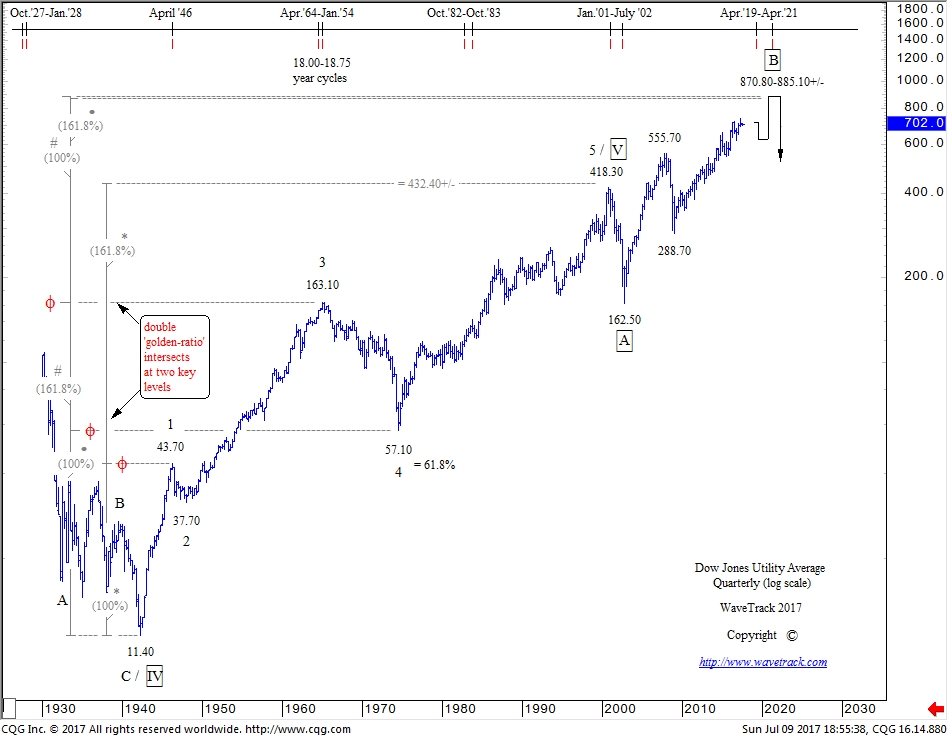
Dow Jones Utilities Average – Quarterly Chart by WaveTrack International
The secular-bull uptrend from the year-1946 low of 11.40 can be seen unfolding into a cycle degree five wave expanding-impulse pattern labelled 1-2-3-4-5. To begin with, it is worth noting that the 5th wave is classified as the ‘extended’ sequence because it is larger than waves 1 and 3. There are also some amazing FIB-PRICES-RATIOs in this pattern. For example, extending cycle wave 1 by a fib. 161.8% ratio projects the terminal high for wave 5 towards 432.40+/-. The actual high traded to 418.30!
The following activity then begins the counter-trend phase of this advance by unfolding into the multi-decennial EXPANDING FLAT pattern. Labelled in super-cycle degree, A-B-C, wave A completed a seven wave double zig zag decline into the Oct.’02 low of 162.50. The following recovery began super-cycle wave B which is itself unfolding into a single zig zag which remains incomplete. We know it is incomplete because of the internal structure of cycle wave C of this zig zag. It requires more upside so that it subdivides into a five wave impulse pattern. But can we ‘proof’ this from using FIB-PRICE-RATIO’s?
Fib-Price-Ratio Answers!
Yes we can. The ‘B’ waves of an expanding flat often trade to higher-highs at the price level intended for the terminal high of the preceding secular-bull uptrend. When the secular-bull uptrend ends short, the ‘B’ wave of the correction compensates by reaching the fib-price-ratio target. This is what we anticipate recurring in the DJUA. For example, extending cycle waves 1-3 of the secular-bull uptrend by a fib. 61.8% ratio projects super-cycle wave B towards 885.10+/-. Also, extending waves 1-4 by an inverse fib. 161.8% ratio projects wave B towards 870.80+/-. This double ‘golden-ratio’ level is the markets ‘harmonic’, it is attracting the price towards it which means the current advance cannot collapse into a secular-bear downtrend until reached sometime over the next few years.
Note that in times of real financial stress, the DJUA collapsed at the same time as all the other indices in 2000-2002, and in 2007-2009 but it tends to provide its defensive role OUTPERFORMANCE at times of lesser importance, like in Q1 2016 (see comments above).
Timing of the end of the Securlar-Bull Uptrend
As for timing the end of a secular-bull uptrend for the DJIA, S&P 500 and the Nasdaq 100, this will be such a major event that we’d expect the Dow Jones UA to also decline rapidly, just as it did in those two previous occasions. The 18.00 and 18.75 year cycles shown at the top of the chart depict a time-horizon anywhere between April ’19 and April ’21. That might seem a big gap to trade in, but it does eradicate the idea from CAPE that a more imminent ‘BLACK SWAN’ event could happen now. We’ll be relying on the final Elliott Wave pattern sequences within super-cycle wave B to help pinpoint the exact timing.
This article is an extract from WaveTrack International’s latest monthly institutional Elliott Wave Navigator report.
For institutional enquiries/subscriptions, please visit us @ www.wavetrack.com or contact us direclty via services@wavetrack.com
Comments
Leave a Reply

Recent Posts
Recent Comments
Archives
- June 2025
- March 2025
- February 2025
- January 2025
- December 2024
- August 2024
- July 2024
- June 2024
- May 2024
- April 2024
- February 2024
- January 2024
- December 2023
- August 2023
- July 2023
- June 2023
- March 2023
- February 2023
- January 2023
- December 2022
- November 2022
- October 2022
- August 2022
- July 2022
- June 2022
- May 2022
- March 2022
- February 2022
- January 2022
- December 2021
- August 2021
- July 2021
- June 2021
- March 2021
- February 2021
- January 2021
- December 2020
- November 2020
- August 2020
- July 2020
- June 2020
- May 2020
- April 2020
- March 2020
- February 2020
- January 2020
- December 2019
- October 2019
- September 2019
- July 2019
- June 2019
- May 2019
- April 2019
- March 2019
- February 2019
- January 2019
- December 2018
- November 2018
- September 2018
- August 2018
- July 2018
- June 2018
- May 2018
- April 2018
- March 2018
- February 2018
- January 2018
- December 2017
- November 2017
- October 2017
- September 2017
- August 2017
- July 2017
- June 2017
- May 2017
- March 2017
- February 2017
- January 2017
- December 2016
- November 2016
- October 2016
- September 2016
- August 2016
- July 2016
- June 2016
- May 2016
- April 2016
- March 2016
- February 2016
- January 2016
- December 2015
- November 2015
- October 2015
- September 2015
- August 2015
- July 2015
- June 2015
- May 2015
- April 2015
- March 2015
- February 2015
- January 2015
- December 2014
- November 2014
- October 2014
- September 2014
- August 2014
- July 2014
- June 2014
- May 2014
- April 2014
- March 2014
- February 2014
- January 2014
- December 2013
- November 2013
- October 2013
- September 2013
- August 2013
- July 2013
- June 2013
- May 2013
- April 2013
- March 2013
- February 2013
- January 2013
- December 2012
- November 2012
- October 2012
- September 2012
- August 2012
Categories
- ADXY Index
- Agnico Eagle Mines
- Alcoa
- Amazon
- AngloGold Ashanti
- Antofagasta
- APPL
- Apple
- ASX 200
- AUD vs USD
- AUDNZD
- AUDUSD
- Australia ASX 200
- Baltic Dry Index
- Banking
- Base Metals
- Biotechnology
- Bitcoin
- Bovespa
- Broadcom
- Catalexit
- central banks
- Christmas
- Commodities
- Commodities Video Outlook 2020
- Conference
- Copper
- Coronavirus Sell-Off
- CRB
- Crude oil
- crude oil price chart
- CryptoCurrency
- Currencies
- Currencies + Interest Rates Video Outlook
- Cycles
- Dax 30
- deutsche bank
- Dewey Cycle
- DJ Transportation Average
- DJ Utilities
- Dow Jones 30
- Dow Theory
- ECB
- economy
- Elliott Wave
- Elliott Wave Charts
- Elliott Wave Patterns
- Elliott Wave Principle
- Emerging Markets
- Ending-Diagonal Elliott Wave Pattern
- Equity
- EUR vs CHF
- EUR/USD
- Euro / US$
- Eurostoxx 50
- EuroStoxx50
- EuroStoxxBanks
- EURUSD
- Expanding Flat Pattern
- FAAMG
- FANG+
- fib-price-ratio
- Fibonacci Trading
- Fibonacci-Price-Ratio
- Financial Forecasting
- Fixed Income
- forex
- Freeport McMoran
- FTSE 100
- Fund Management
- FX
- FXStreet
- GBP/AUD
- GBP/USD
- GDX
- GDXJ
- Germany 10 year Euro Bund future
- Gilead Sciences
- Glencore
- Global Economy
- Gold
- Gold Mining
- Golden Ratio
- goldman sachs
- Google Inc.
- Google/Alphabeth
- Greek debt crisis
- Hang Seng
- Harbinger
- Hungarian Forint
- IBEX 35 Index Spain
- Independent Research
- India-CNX Nifty 50
- Interest Rates
- Interview
- IRP Independent Research
- kbw bank index
- Lonmin
- McDonald's
- MID-YEAR VIDEO UPDATE!
- Mifid II
- Mines
- Mining
- MSCI China
- MSCI Emerging Markets
- Nasdaq 100
- Nasdaq Biotechnology Index
- Nasdaq Composite
- Nasdaq100
- Netflix
- Newmont Mining
- Nikkei 225
- NVIDIA
- NYSE Composite Index
- Palladium
- Platinum
- Precious Metals
- Ralph Nelson Elliott
- Reversal-Signature
- Russell 2000
- Russia RTS
- S&P 500
- Sector
- Secular-Bull
- Sentiment Survey
- Shanghai Composite Index
- Silver
- Slanting Flat Elliott Wave Pattern
- SP100
- SP400 Mid-Cap
- SP500
- SPX 500
- STLG/AUD
- Stlg/US$
- STLG/USD
- STLG/YEN
- STLG/ZAR
- Stock Index
- Stock Index Tracking
- Stock Index Video
- Stock Indices
- Stock Indices Video Outlook 2023
- Stock Indices Video Outlook 2025
- Sugar
- Summary
- Tesla
- Tesla Inc
- Toyota
- Track Record
- trading
- Trusts
- Tutorial
- Uncategorized
- UniCredit
- US
- US Dollar Index (DXY) (USDX)
- US$ Index
- US-Dollar Index
- US10yrYields
- USD
- USD/ARS
- USD/CNY
- USD/IDR
- USD/INR
- USD/MXN
- USD/SGD
- USD/THB
- USD/YEN
- USD/ZAR
- Vale
- Value Line Index
- video
- VIDEO OUTLOOK 2018
- VIDEO OUTLOOK 2020
- VIX
- W.D. Gann
- WaveTrack International
- XAU Gold/Silver Index
- Xetra Dax
- XOP
- Yields
- Zig Zag
- Zinc
- ‘INFLATION-POP’
- ‘SHOCK-POP-DROP’