New Currencies + Interest Rate Video Outlook 2023
by WaveTrack International| February 25, 2023 | No Comments
Currencies and Interest Rate Video Outlook 2023
Inflation Ticks Higher before Resuming Lower – Short but Sharp Recession for 2023
Currencies and Interest Rates Highlights
Yield Inversion Normalises into Steeper Trajectory
Bank of Japan Raise JGB Limit
Outlook Preview Currencies
• Central Banks (CBs) have overestimated the impact from 6-month declines in headline Consumer Price Index (CPI) prices – whilst CB’s are still maintaining their interest rate-hiking cycles, they’ve slowed the pace as they approach perceived ceilings – market participants have expected a Fed-Pivot but this is unlikely right now – Elliott Wave analysis expects further interest rate rises through Q1/2 ’23 before a collapse lower afterwards as risk-assets sell-off triggering a short but sharp recession for 2023.
• The long-term outlook for the US$ dollar index remains very bearish – the year-1985 decline from record highs of 164.72 began a cycle degree A-B-C zig zag correction – wave A ended at 85.33 in 1987 and wave B only recently, into the Sep.’22 high of 114.78 – wave C has since begun a primary degree five wave impulse decline where ultimate downside targets remain towards 51.18+/-. That’s a depreciation of -55% per cent before the end of the decade.
Outlook Preview – Interest Rates
• The 60-year cycle in Corporate AAA Bond Yields formed a major low in year-2011 which ordinarily translates into a new sustained half-cycle uptrend of 30+/- years – but the COVID-19 coronavirus pandemic forced more monetary accommodation from central banks, prolonging the previous 30-year cycle downtrend even longer – but the March ’20 lows are finally secure, confirming a new 30+ year uptrend for interest rates has begun.
• Central Banks & Inflation – In last year’s mid-year report, we forecast an interim high for inflation and a pullback lasting several months, maybe longer. That scenario has unfolded to plan – U.S. headline CPI has pulled lower from last June’s high of 9.1% to 6.4% in Jan.’23 fueling market expectations of higher risk-assets, i.e. stocks and commodities on a growing belief that inflation has peaked, Central Banks will deliver a soft (economic) landing, consumers adapting to higher costs and a China reopening. But Elliott Wave analysis suggests this is too optimistic – inflationary pressures are expected to tick higher during the next 2-3 months causing a re-think from the consensus Fed-Pivot/soft-landing forecasts – rather, Central Banks are forced to turn more hawkish, prolonging the current interest rate hiking cycle, i.e. higher-rates-for-longer. This triggers a risk-asset collapse which later turns yields lower but not before higher-highs during the next 2-3 months.
Currencies – US$ Dollar Index – Long-Term Cycle
The origin of the US$ dollar goes back to the 1660’s when the Spanish Real-de-a-Ocho, also known as the piece of eight, is a silver coin worth eight Spanish Reales. It was minted in the Spanish Empire following a monetary reform in 1497 with content 25.563 g = 0.822 oz t fine silver (Quarterly Forecast chart in our latest report!).
The amazing thing about the price development of the Spanish dollar into the American dollar is the way in which it unfolds over many centuries into a perfectly formed Elliott Wave impulse pattern consisting of five waves from the all-time-low of the American Civil War low of 1864 into the eventual peak of 1985. That five wave expanding impulse ending on a quarterly closing price of 149.46 (intraday at 164.72) explains why the dollar has been declining ever since reaching this peak – because the completion of a five wave uptrend must next be compensated by a three wave correction, in this case, labelled as a cycle degree A-B-C zig zag which is still unfolding to this day.
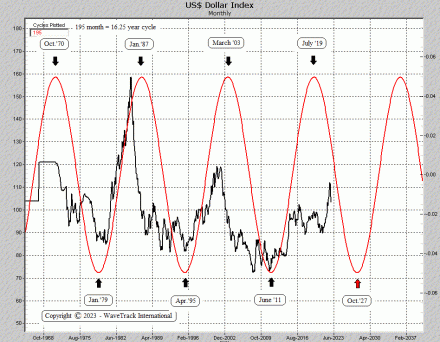
Cycle wave B ended last September ’22 at 114.78 having completed a primary degree running flat pattern from the Oct/’87 low of 85.33. Extending wave A (including the lower-low to 70.70 of wave B) by a fib. 38.2% ratio projects wave C down to 51.18+/- within the next several years. Such a decline would emulate wave A’s decline which took 2½ years to complete – that’s a dollar depreciation of -55% per cent with a date for completion in March ’25.
We think it will take a little longer basis the 195-month, 16.25-year cycle which depicts the next major low around Oct.’27 – see fig #216.
Preview Currencies – USD vs. CAD
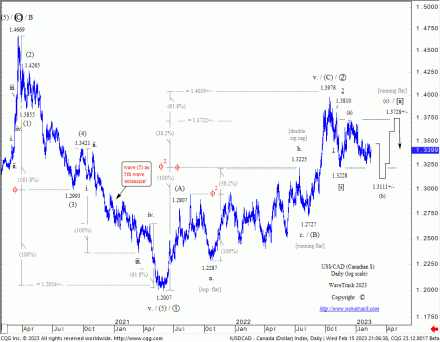
US$/CAD Canadian dollar ended cycle wave B at 1.4040 (146.69) into the pandemic high and is now trending lower as cycle wave C during the next several years. Shorter-term, the outlook is unclear with primary wave 2’s rally from the June ’21 low of 1.2007 ending into the Oct.’22 high of 1.3978 alongside a US$ dollar index peak – but so far, no five wave impulse decline to confirm the new downtrend. See fig 253.
Year of Opportunity and Vigilance – Be Prepared
Our EW-team worked hard to put this information together in a way that is comprehensive to ensure that you are prepared for the major FX moves to come in 2023 and beyond. Check out the table of contents below and if you are trading Currencies – don’t miss it!
We invite you to take this next step in our financial journey with us – video subscription details are below – just follow the links and we’ll see you soon!
Most sincerely,
Peter Goodburn
Founder and Chief Elliott Wave Analyst
WaveTrack International
What you get
Contents: 150 charts | VIDEO DURATION: nearly 2 hours 44 mins.
The contents of this CURRENCIES & INTEREST RATES VIDEO include Elliott Wave analysis for:
Forex (151 charts):
• US CPI
• US PCE
• US$ Index + Cycles
• Euro/US$ + Cycles
• Stlg/US$
• US$/Yen
• US$/CHF
• US$/NOK
• US$/SEK
• AUD/US$
• US$/CAD
• NZD/US$
• Euro/Stlg
• Euro/Yen
• Euro/CNY Renminbi
• Stlg/YEN
• Stlg/AUD
• Stlg/ZAR
• AUD/YEN
• AUD/CNY Renminbi
• AUD/NZD
• Asian ADXY
• US$/Renminbi
• US$/KRW
• US$/SGD
• US$/INR
• US$/TWD
• USD/THB
• US$/MYR
• US$/IDR
• US$/PHP
• USD/BRL
• USD/RUB
• US$/ZAR
• US$/MXN
• US$/TRY
• US$/PLZ
• Bitcoin
• Ethereum
Interest Rates (53 charts):
• US10yr Real Yield
• US30yr Yield + Cycles
• US10yr Yield + Cycles
• US5yr Yield
• US2yr Yield
• US2yr-10yr Yield Spread
• US10yr-30yr Yield Spread
• 3mth EuroDollar-US10yr Yield Spread
• Comparison US10-DE10yr vs S&P 500
• US10yr TIPS Break Even Inflation Rate
• US10-DE10yr Yield Spread
• DE10yr Yield
• ITY10yr Yield
• Italy10-DE10yr Yield Spread
• Australia 10yr Yield
• Japan 10yr Yield
How to buy the Forex + Bonds Video Outlook 2023
Simply contact us @ services@wavetrack.com to buy the CURRENCIES + INTEREST RATES Video Outlook 2023 for USD 49.00 (+ VAT where applicable) or alternatively our Triple Video Offer for USD 99.00 (+ VAT where applicable) – Review the content of WaveTrack Stock Indices Video PART I here and the Commodities Video PART II here.
*(additional VAT may be added depending on your country – currently US, Canada, Asia have no added VAT but most European countries do)
We’re sure you’ll reap the benefits – don’t forget to contact us with any Elliott Wave questions – Peter is always keen to hear you views, queries and comments.
Visit us @ www.wavetrack.com
Comments
Leave a Reply


