March ’20 Zig Zag Advances Completing 1st Wave Uptrends
by WaveTrack International| March 24, 2021 | No Comments
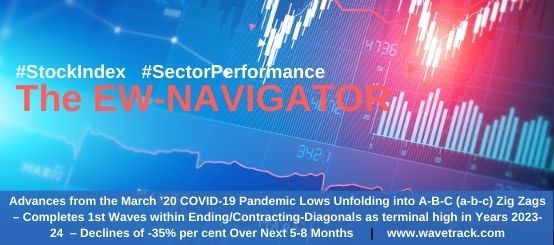
Advances from the March ’20 COVID-19 Pandemic Lows Unfolding into A-B-C (a-b-c) Zig Zags – Completes 1st Waves within Ending/Contracting-Diagonals as terminal high in Years 2023-24 – 2nd Wave Corrections Unfolding Now – Declines of -35% per cent Over Next 5-8 Months
Growth stocks
Growth stocks led the way during the early stages of the post-Coronavirus pandemic recovery of last year (2020). However, there’s since been a switch of outperformance in value stocks as growth got a bit stretched over the past couple of months. Rotation has also caused periods when large-caps lagged behind the outperforming small/mid-cap stocks/indices. Then there’s been a sudden underperformance in technology stocks/indices as long-dated treasury yields pushed strongly higher, making this industry less competitive relative to the broader market.
Critical Information
But amidst all of these uneven bumps, there’s emerged a defining Elliott Wave pattern development from the March ’20 COVID-19 lows. So many indices, large cap, mid-cap and small-cap together with several sectors alongside Emerging Markets/Asian indices have all unfolded into A-B-C zig zags. That’s really important. No, critical information because zig zags unfolding directionally higher following crash lows that formed last year can only be positioned in this case, within one type of larger Elliott Wave pattern – and that’s an ending-diagonal.
This month’s report examines how these A-B-C zig zags fit together into their larger degree ending-diagonal patterns across the major indices – see fig’s #1 & #2. But there’s a chilling outcome too. These zig zags are completing the 1st waves within developing five wave contracting-type diagonals which requires deep 2nd wave corrections. That could wipe out the current equity rally with declines of between -30% to -40% per cent over the next 5-8 month period.
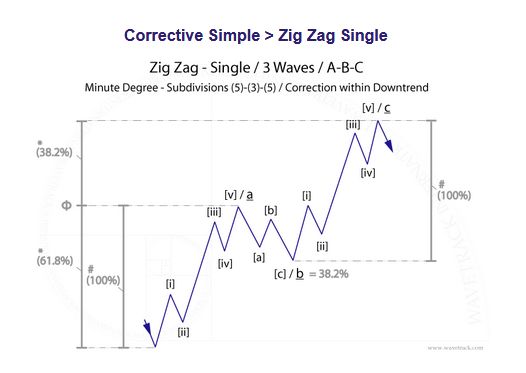
Fig #1 – Zig Zag Single
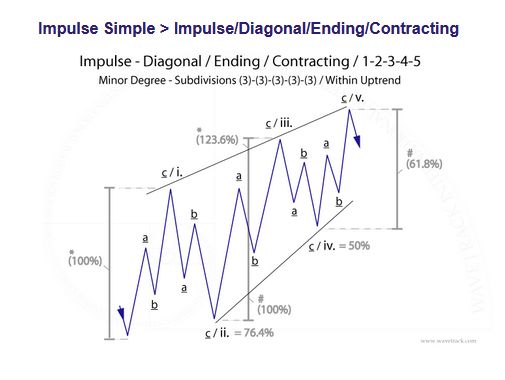
Fig #2 – Impulse Diagonal Ending Contracting by WaveTrack International
Such a decline could be triggered by any number of exogenous catalysts. For one thing, European countries are heading for a third-wave lockdown. The data backs-up the idea of a strong collapse in equities. Just look at the exponential gains in global equity flows so far this year which dwarfs anything every before – see fig #3. Exponential rises like this always turn into a parabolic curve, resulting in a deep downswing. That in itself could easily translate into a sharp downturn in evaporating fund allocation.
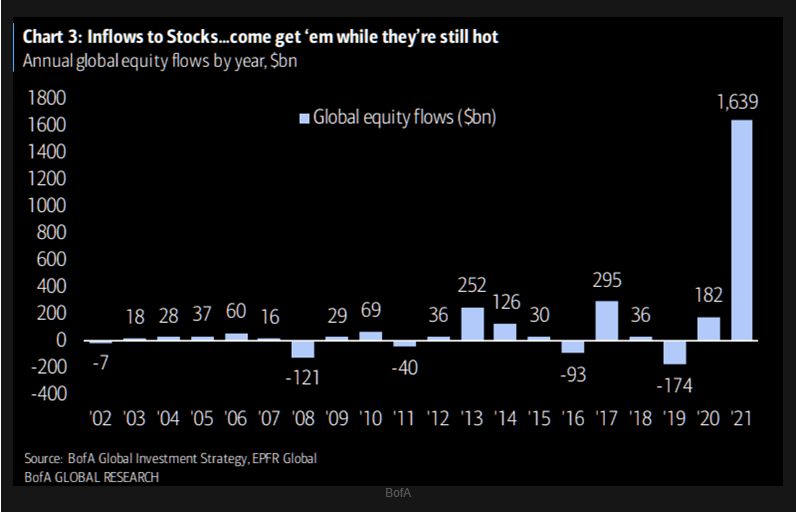
Fig #3 – Global Equity Flows – Source: Bank of America
Fund Manager Survey
The latest Fund Manager Survey from Bank of America reveals that 91% per cent of FM’s expect a stronger economy for the remainder of this year. This is the highest figure EVER! – see fig #4. If that isn’t a bearish contrarian signal, then what is?
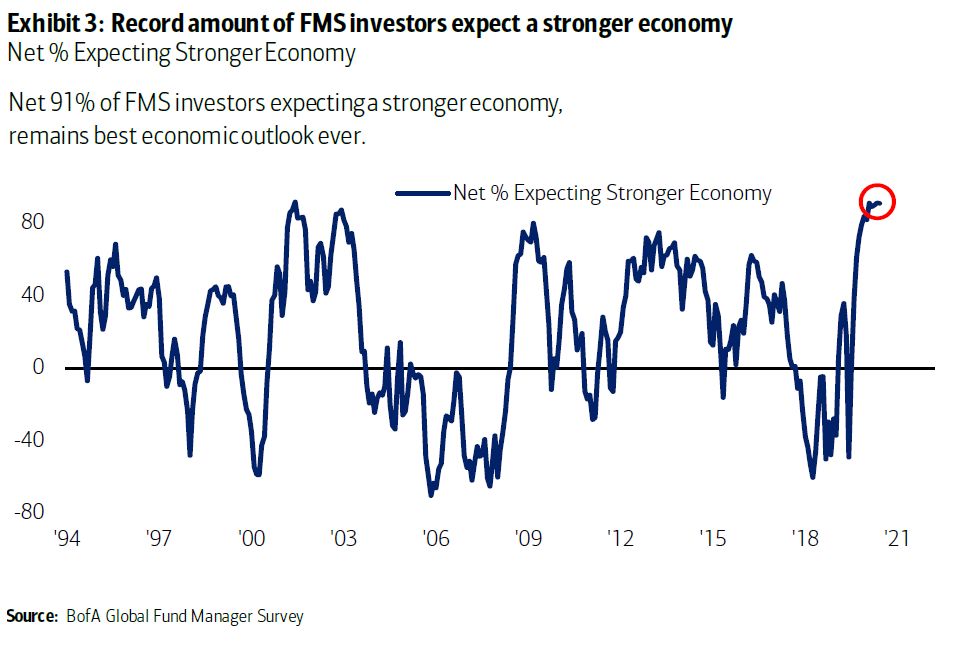
Fig #4 – Economic Outlook – Source: Bank of America
MSCI Emerging Markets
One of the benchmark illustrations of the Elliott Wave a-b-c zig zag advances from last year’s low is shown in the MSCI Emerging Market index – see fig #5. Note how wave a.’s high at 1129.00 x 61.8% equals the terminal high of wave c. at 1449.00. This ‘proofs’ its completion as the 1st wave within the larger degree ending/contracting-diagonal pattern. The final pattern of the secular-bull uptrend.
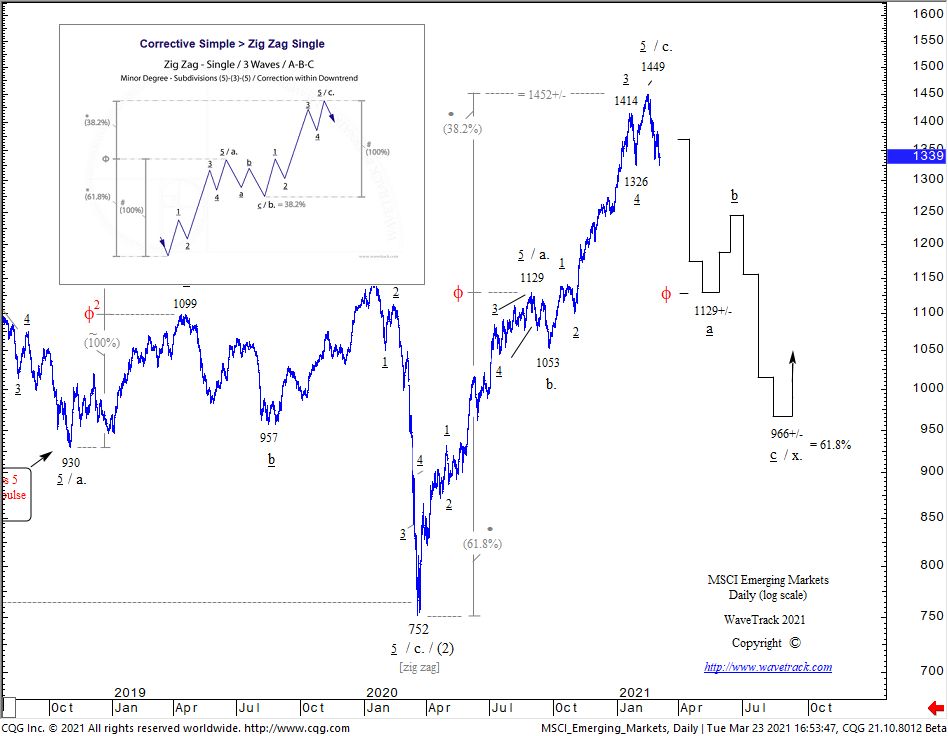
Fig #5 – MSCI Emerging Markets – Daily – WaveTrack International
A huge 2nd wave correction is about to get underway. Ordinarily, 2nd wave corrections within contracting-type diagonals retrace the 1st wave by fib. 76.4% per cent. But in our example, we’ve been more conservative showing the fib. 61.8% ret. level at 966.00+/-. But that’s still a decline of -33% per cent!
And recently, we’ve seen huge inflows into Emerging Markets. See Bank of America’s FMS survey results which show emerging markets are expected to be the No.1 outperformance asset class compared to the S&P 500, Crude Oil, Gold, U.S. Housing, Bitcoin and US30yr treasuries see fig #6.
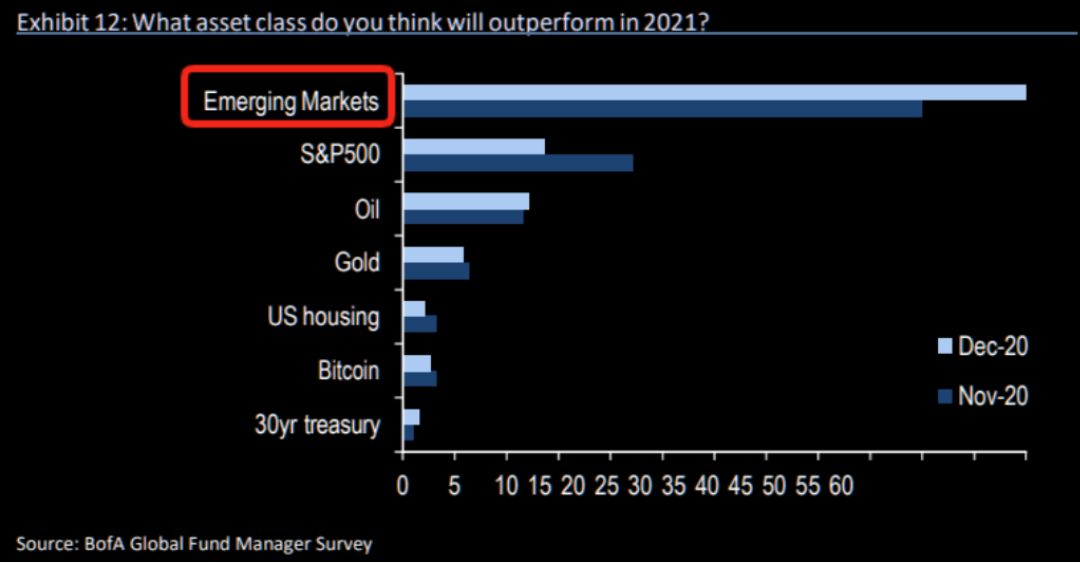
Fig #6 – Asset Class Outperformance – Bank of America
The MSCI EM’s diagonal pattern has been well documented in our Elliott Wave analysis for a number of years. Here’s an update of what it looks like today – see fig #7.
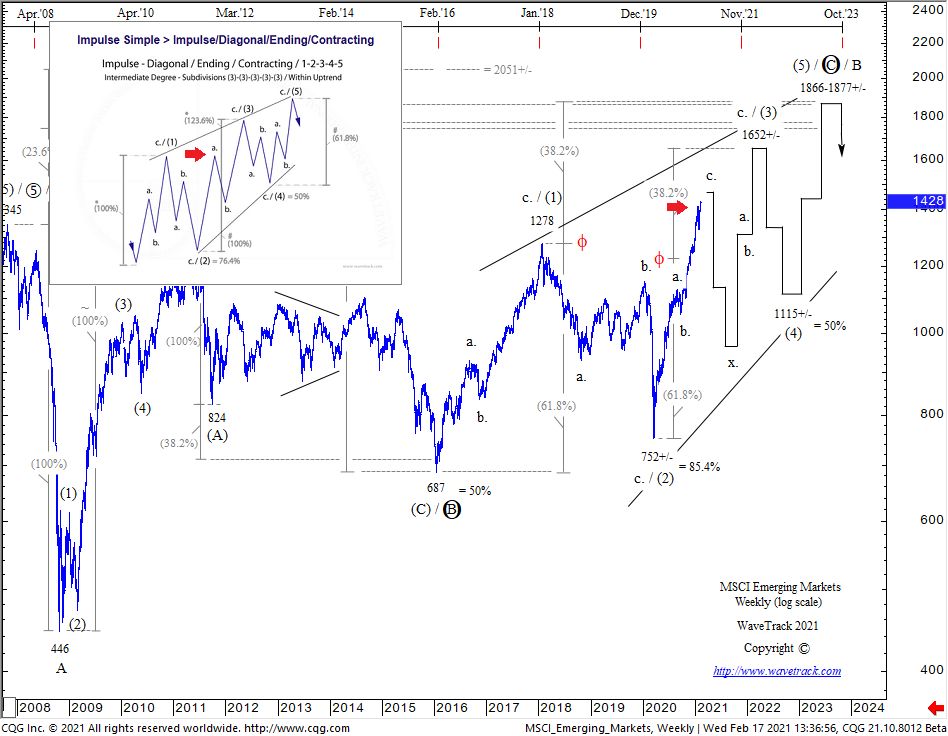
Fig #7 – MSCI Emerging Markets – Weekly by WaveTrack International
March ’20 Zig Zag Advances Completing 1st Wave Uptrends – read more in WaveTrack Elliott Wave Navigator report!
Comments
Leave a Reply

Recent Posts
Recent Comments
Archives
- June 2025
- March 2025
- February 2025
- January 2025
- December 2024
- August 2024
- July 2024
- June 2024
- May 2024
- April 2024
- February 2024
- January 2024
- December 2023
- August 2023
- July 2023
- June 2023
- March 2023
- February 2023
- January 2023
- December 2022
- November 2022
- October 2022
- August 2022
- July 2022
- June 2022
- May 2022
- March 2022
- February 2022
- January 2022
- December 2021
- August 2021
- July 2021
- June 2021
- March 2021
- February 2021
- January 2021
- December 2020
- November 2020
- August 2020
- July 2020
- June 2020
- May 2020
- April 2020
- March 2020
- February 2020
- January 2020
- December 2019
- October 2019
- September 2019
- July 2019
- June 2019
- May 2019
- April 2019
- March 2019
- February 2019
- January 2019
- December 2018
- November 2018
- September 2018
- August 2018
- July 2018
- June 2018
- May 2018
- April 2018
- March 2018
- February 2018
- January 2018
- December 2017
- November 2017
- October 2017
- September 2017
- August 2017
- July 2017
- June 2017
- May 2017
- March 2017
- February 2017
- January 2017
- December 2016
- November 2016
- October 2016
- September 2016
- August 2016
- July 2016
- June 2016
- May 2016
- April 2016
- March 2016
- February 2016
- January 2016
- December 2015
- November 2015
- October 2015
- September 2015
- August 2015
- July 2015
- June 2015
- May 2015
- April 2015
- March 2015
- February 2015
- January 2015
- December 2014
- November 2014
- October 2014
- September 2014
- August 2014
- July 2014
- June 2014
- May 2014
- April 2014
- March 2014
- February 2014
- January 2014
- December 2013
- November 2013
- October 2013
- September 2013
- August 2013
- July 2013
- June 2013
- May 2013
- April 2013
- March 2013
- February 2013
- January 2013
- December 2012
- November 2012
- October 2012
- September 2012
- August 2012
Categories
- ADXY Index
- Agnico Eagle Mines
- Alcoa
- Amazon
- AngloGold Ashanti
- Antofagasta
- APPL
- Apple
- ASX 200
- AUD vs USD
- AUDNZD
- AUDUSD
- Australia ASX 200
- Baltic Dry Index
- Banking
- Base Metals
- Biotechnology
- Bitcoin
- Bovespa
- Broadcom
- Catalexit
- central banks
- Christmas
- Commodities
- Commodities Video Outlook 2020
- Conference
- Copper
- Coronavirus Sell-Off
- CRB
- Crude oil
- crude oil price chart
- CryptoCurrency
- Currencies
- Currencies + Interest Rates Video Outlook
- Cycles
- Dax 30
- deutsche bank
- Dewey Cycle
- DJ Transportation Average
- DJ Utilities
- Dow Jones 30
- Dow Theory
- ECB
- economy
- Elliott Wave
- Elliott Wave Charts
- Elliott Wave Patterns
- Elliott Wave Principle
- Emerging Markets
- Ending-Diagonal Elliott Wave Pattern
- Equity
- EUR vs CHF
- EUR/USD
- Euro / US$
- Eurostoxx 50
- EuroStoxx50
- EuroStoxxBanks
- EURUSD
- Expanding Flat Pattern
- FAAMG
- FANG+
- fib-price-ratio
- Fibonacci Trading
- Fibonacci-Price-Ratio
- Financial Forecasting
- Fixed Income
- forex
- Freeport McMoran
- FTSE 100
- Fund Management
- FX
- FXStreet
- GBP/AUD
- GBP/USD
- GDX
- GDXJ
- Germany 10 year Euro Bund future
- Gilead Sciences
- Glencore
- Global Economy
- Gold
- Gold Mining
- Golden Ratio
- goldman sachs
- Google Inc.
- Google/Alphabeth
- Greek debt crisis
- Hang Seng
- Harbinger
- Hungarian Forint
- IBEX 35 Index Spain
- Independent Research
- India-CNX Nifty 50
- Interest Rates
- Interview
- IRP Independent Research
- kbw bank index
- Lonmin
- McDonald's
- MID-YEAR VIDEO UPDATE!
- Mifid II
- Mines
- Mining
- MSCI China
- MSCI Emerging Markets
- Nasdaq 100
- Nasdaq Biotechnology Index
- Nasdaq Composite
- Nasdaq100
- Netflix
- Newmont Mining
- Nikkei 225
- NVIDIA
- NYSE Composite Index
- Palladium
- Platinum
- Precious Metals
- Ralph Nelson Elliott
- Reversal-Signature
- Russell 2000
- Russia RTS
- S&P 500
- Sector
- Secular-Bull
- Sentiment Survey
- Shanghai Composite Index
- Silver
- Slanting Flat Elliott Wave Pattern
- SP100
- SP400 Mid-Cap
- SP500
- SPX 500
- STLG/AUD
- Stlg/US$
- STLG/USD
- STLG/YEN
- STLG/ZAR
- Stock Index
- Stock Index Tracking
- Stock Index Video
- Stock Indices
- Stock Indices Video Outlook 2023
- Stock Indices Video Outlook 2025
- Sugar
- Summary
- Tesla
- Tesla Inc
- Toyota
- Track Record
- trading
- Trusts
- Tutorial
- Uncategorized
- UniCredit
- US
- US Dollar Index (DXY) (USDX)
- US$ Index
- US-Dollar Index
- US10yrYields
- USD
- USD/ARS
- USD/CNY
- USD/IDR
- USD/INR
- USD/MXN
- USD/SGD
- USD/THB
- USD/YEN
- USD/ZAR
- Vale
- Value Line Index
- video
- VIDEO OUTLOOK 2018
- VIDEO OUTLOOK 2020
- VIX
- W.D. Gann
- WaveTrack International
- XAU Gold/Silver Index
- Xetra Dax
- XOP
- Yields
- Zig Zag
- Zinc
- ‘INFLATION-POP’
- ‘SHOCK-POP-DROP’