Stock Indices Mid-Year Video Update PART I/III
by WaveTrack International| June 14, 2022 | No Comments
STOCK INDICES MID-YEAR VIDEO UPDATE 2022 Part I/III
2022’s Correction Hits Interim Targets – Final Lows in October-December
Stock Indices Report PART I
This year’s stock market trends have certainly been impacted by the new rate hike cycle. The S&P 500 is down -20% per cent from January’s high into May’s low whilst the Nasdaq 100 is down -30% per cent. ETF’s like the Fangs+ technology index is down -42% per cent with individual component equities down by -77% per cent. In terms of performance, it’s a very mixed affair. On the other side of the scale, outperforming sectors like Consumer Staples (XLP) held up pretty well, trading to a new post-pandemic high last April, and only then staging sharp declines that begin multi-month corrections.
What next?
So far, the annual Stock Indices Report PART I published last December ’21 called this market downturn perfectly – see Fig #1 – but what next?
Fig #1 – Stock Indices Track Record December 2021 Outlook 2022 Video Report by WaveTrack International
U.S. indices have declined from their November/January highs into ‘a-b-c’ zig zag patterns that ended into the May lows. Sentiment was registering bearish extremes at the time and this pessimism was also seen in various Fund Manager surveys. But as prices recover higher. So analysts are now questioning whether this is simply a counter-trend rally or the resumption of the prevailing secular uptrend?
In this mid-year Stock Indices PART I report, we’ll show clues suggesting May’s recovery is most likely a counter-trend bounce ahead of more declines later this year.
Stock Indices World – Bovespa Brazil Forecast
Fig #2 – PREVIEW – Bovespa – Daily – Forecast Stock Indices 2022 Mid-Year Report by WaveTrack International
Supporting this outlook, we’ll be taking a look at a very different type of corrective pattern that began unfolding from last November’s high in Europe from February’s high in Australia. These establish critical archetypes and Elliott Wave price forecasts for other major indices from around the world, in Brazil, Saudi Arabia, India, Singapore, Taiwan and Japan – and in China, Hong Kong, a few surprises too!
New Stock Indices 2022 Video – PART I/III
This 2022 MID-YEAR VIDEO UPDATE for STOCK INDICES is like nothing you’ve seen anywhere else in the world. It’s unique to WaveTrack International, how we foresee trends developing through the lens of Elliott Wave Principle (EWP) and how its forecasts correlate with Cycles, Sentiment extremes and Economic data trends.
We invite you to take this next step in our financial journey with us – video subscription details are below – just follow the links and we’ll see you soon!
Most sincerely,
Peter Goodburn
Founder and Chief Elliott Wave Analyst
WaveTrack International
Contents Stock Indices Mid-Year Video Update 2022
Charts: 91 | Video: 2 hours 40 mins.
Read more «Stock Indices Mid-Year Video Update PART I/III»
Commodity Highlights
by WaveTrack International| May 4, 2022 | No Comments
‘COMMODITY CORRECTION DURING NEXT 6-8 MONTHS’ – ‘PAUSE WITHIN INFLATION-POP’ CYCLE UPTREND’ – INFLATIONARY PRESSURES EASE – Base Metals Turning Down – Energy Resuming March’s Decline – Precious Metals Testing Important Support Levels – Gold Miners Remain Bullish
Extract from May’s Elliott Wave Commodity Outlook Report
Commodity May Report – In This Edition
Base Metals
Commodity prices have continued to trade near relative post-pandemic highs. But they’ve also remains below the March peaks in a sign of directional change. Base Metals are trading lower over the week following last month’s short-term corrective rallies. Prices for Copper, Aluminium, Lead and Zinc are all heading lower. Negative headwinds are centered around a strong US$ dollar. However more recently, the impact from China’s latest city-wide coronavirus lockdowns are raising concerns.
Inflationary pressures remain in focus as long-dated U.S. interest rates remain stubbornly high although there are several signs of an imminent interim peak forming within this inflation-pop cycle.
U.S. headline Consumer Price Index (CPI) continued to break records with the March ’22 data at 8.5% per cent whilst the Fed’s PCE headline numbers are at 6.6% per cent, core at 5.2% per cent. The Federal Reserve remains on track to deliver a 50bps hike in rates this week to 0.75-1.00% per cent although it remains far behind the curve. Its quantitative tightening programme is too little, too late with the bond market pricing-in too much at current levels. One elevator is rising whilst the other is declining.
US Dollar
The US$ dollar has exceeded our upside expectations although the longer-term picture remains bearish. A dollar peak sometime this month would represent an ensuing decline as inflation-trade long-positioning is unwound.
Precious Metals and Miners
Precious metals have been declining over the last month. This trend is in-line with Elliott Wave analysis with downside risk in focus. But there are alternate bullish counts which show an imminent low forming just below current price levels in gold and silver that could, if held, turn things around. Several of the gold miners are approaching important support levels, turning bullish.
Energy
In the Energy markets, Natural Gas has been the commodity that has continued higher over the last month. Although it too has hit some important upside levels and is now edging lower. Crude and Brent oil completed their five wave impulse post-pandemic uptrends into the March highs and is set to accelerate lower this month in a continuation of multi-month corrections. The XLE Energy ETF and the XOP Oil & Gas ETF’s are also set to head lower.
DB-Agriculture Fund ETF
Inflation-led commodities like grains and other foodstuffs are trading into upside resistance levels as measured in the DB-Agriculture Fund ETF. An ensuing corrective downswing is expected to begin now, lasting into year-end. A correction is also signalled for the FAO’s Food & Agriculture index.
The Food and agriculture sectors have been in focus once again as inflationary pressures continue to rise. Ukraine is a major producer of grains to the world (see graphic in last month’s Elliott Wave Commodity April 2022 report – fig #2) and as the war with Russia rolls on, so has there been talk of major shortages due to disruptions in the spring planting season. There’s also problems with supplies of fertilizers which rely on natural gas for conversion. And natural gas prices have risen exponentially over the last couple of years. China is apparently hoarding over half of the world’s grain. This year, China will have 69% per cent of the world’s corn, 60% per cent of its rice and 51% per cent of its wheat. The question is why? Are they expecting some catastrophic event?
Commodity Spotlight China
Beginning in 1999/2000, China implemented grain policies to reduce its excessive stocks. By early 2004, with global stocks at a more normal level relative to use, global rice prices began to slowly increase. Prices then rose exponentially higher. However, China secured a long-term lease with Madagascar back in 2008 to grow rice ensuring supplies when prices had just reached an all-time-peak. In hindsight, that was a really bad trade as prices collapsed lower in subsequent years. Which means the build-up of its current stockpile might simply be due to a hard learning curve from the rice explosion of a decade earlier.
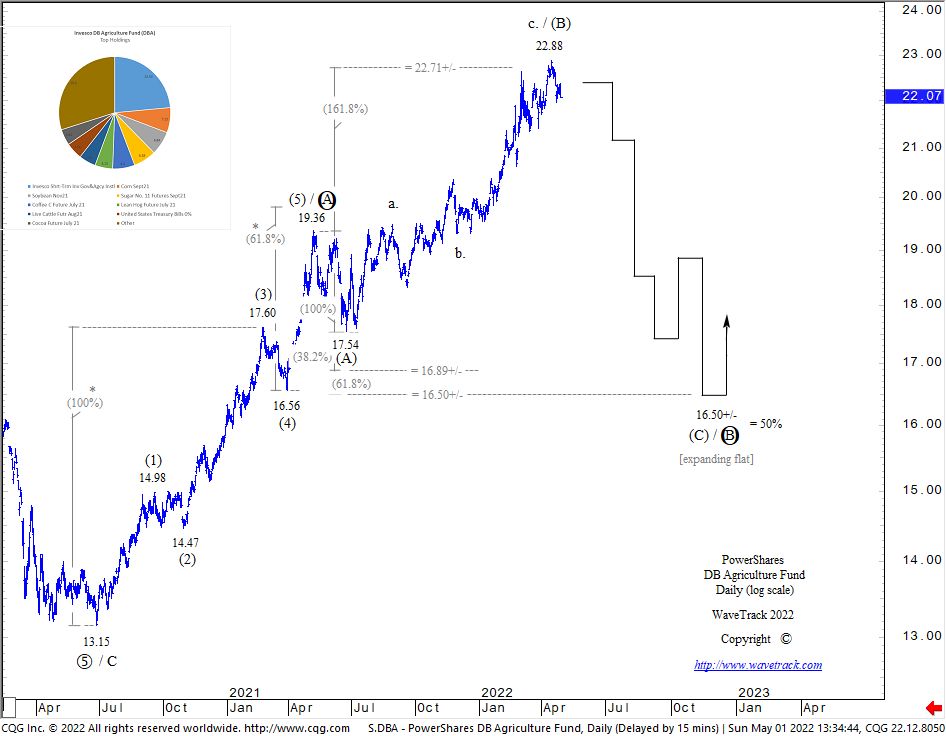
Fig #1 – PowerShares DB Agriculture Fund – Daily by WaveTrack International
The DB Agriculture Fund (ETF) has unfolded higher from the pandemic low of 13.15. Now, completing a five wave impulse pattern into the May ’21 high of 19.36 as primary wave A – see fig #1. This is an important date as will become apparent later. It’s the same date that ended the post-pandemic five wave impulse uptrend for the US10yr Breakeven Inflation Rate (TIPS) and for LME 3mths Copper. All three contracts have since begun corrective downswings in the form of expanding flats. For the Agriculture Fund, this is labelled in intermediate degree, (A)-(B)-(C) where wave (B) has just completed into April’s high of 22.88. Wave (C) is set to decline over the coming months. Ultimate targets remain unchanged towards 16.50+/-.
Food & Agriculture Index
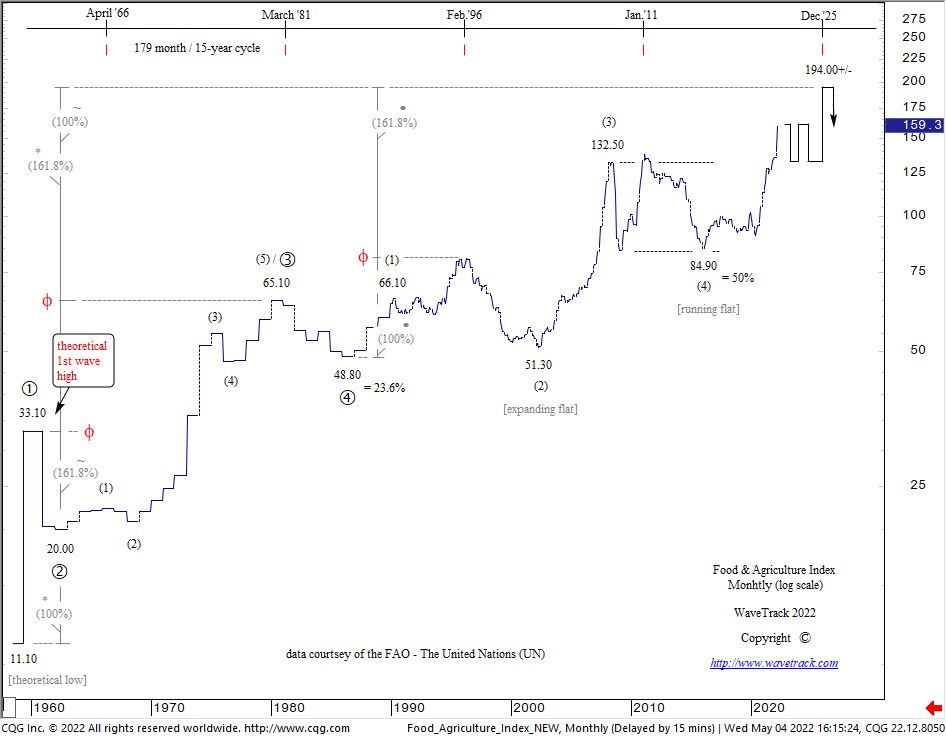
Fig #2 – Food and Agriculture Index – Monthly by WaveTrack International
The Food & Agriculture Organisation, a division of the United Nations posted latest data for the Food & Agriculture Index – see fig #2. Intermediate wave (5)’s advance within the long-term primary degree uptrend began from grand ‘Re-Synchronisation’ low of 84.90 of late-2015/early-2016. This advance is developing nicely, into a smaller degree five wave impulse pattern, i-ii-iii-iv-v where its 3rd wave is peaking now at 159.30. Note, a corrective 4th wave is forecast over the next 6-8 month period. This is an indication that the current scarcity narrative being broadcast in mainstream media is overcooked. A correction would also mean inflationary pressures are set to pause for a while.
Special Coverage of Base Metals, Precious Metals, Energy and Metal Miners in WaveTrack’s latest Elliott Wave Commodity Report
Available here EW-Commodity Report Subscription for USD 240 per month.
Currencies + Interest Rates Video Outlook 2022 | PART III/III
by WaveTrack International| March 1, 2022 | No Comments
Currencies + Interest Rates Video Outlook 2022 | PART III/III
Currencies – US$ Dollar Index Approaching 14-Month Corrective Upside Target – Next Declines Begin Multi-Year Downtrend – US$ Dollar Devaluation Ahead – Loss of Confidence as Reserve Currency – G10 Currency Pairs Begin New Uptrends Due to US$ Weakness – Commodity Currencies Bullish Despite Underlying Commodity Correction – Asian ADXY Currencies Begin New Uptrends – U.S. Long-Dated Interest Rates Form Important Highs – Begin Multi-Month Corrective Downswings – Shorter-Dated Yields Mixed/Trending Higher But Mature – Flattening Continues – European Long-Dated Interest Rates Hit Tops – Downside Corrections – Flattening Curve – Italy/Australia/Japan All Confirm Corrective Declines Ahead – Inflationary Pressures Ease/Decline
INCLUDES ANALYSIS ON MAJOR US$ DOLLAR PAIRS/CROSSES – ASIAN/EM CURRENCIES – MEDIUM-TERM CYCLES – LONG-DATED YIELDS US/EUROPE/ITALY/AUSTRALIA/JAPAN + MANY SPREADS
Currencies EW-Forecasts for 2022
The US$ dollar index is engaged in a 15.6-year to max. 16-year cycle that connects troughs-to-troughs or lows-to-lows over the last several decades going back to the 1960’s – see fig’s #227 & #229 in the Currencies and Interest Rates report. The corresponding peaks are ‘centrally translated’, a cycle term we use to describe the time-interval that marks the half-way point of the full cycle period, i.e. half of 15.6-years is 7.8-years. But it’s more than that – centrally translated actually means dividing the 15.6-year interval in half so that there are approximately equal periods of upward/rising dollar strength versus downward/declining weakness.
The 15.6-year and 16-year cycles both project the US$ dollar lower during the next several years, into lows due around 2024-27. The Elliott Wave modelling provides some idea of the amplitude of this decline.
Currenies + Crypto-Currencies
Bitcoin’s long-term uptrend remains in progress from its inception trade of $0.08 back in 2010 – ultimate upside targets during next several years towards 295.400+/-. A trading-range triangle is continuing to develop April ’21 high of 64858.10 with another upswing during next months – Review Daily Bitcoin forecast – Fig #326. Ethereum set to outperform Bitcoin during next few years basis Ethereum/Bitcoin Ratio widening from 0.07127 out to 0.45000+/-.
Fig #326 – Bitcoin – Daily Elliott Wave Forecast by WaveTrack International
Currencies – The Next 6-8 Months
Once the US$ dollar index ends last year’s correction, it then begins a new downtrend, resuming primary wave 3 as minor wave iii. three within intermediate wave (3). From an Elliott Wave standpoint, that evokes an accelerative 3rd-of-3rd wave decline which will be devastating for the dollar. What could trigger such a decline?
The most probable driver is rising costs and inflationary pressures. Whilst we expect a pause in inflationary pressures this year, central banks are ‘behind-the-curve’, are late in responding to the last year’s rising inflationary pressures. They are ready to hike interest rates, borrowing costs at a time when those very inflationary measures are about to turn down for 6-8 months. However, the Federal Reserve in particular, is panicking.
If they begin hiking/tightening at a time when long-dated yields are declining because of an economic correction, then an unwinding of the inflation-trade positioning would see the dollar decline for the remainder of this year. And in 2023, continuing to trend lower because deflating the dollar is the only way out for the U.S. government and the Federal Reserve to lessen its dollar payment obligations.
Highlights – Interest Rates
The 60-year cycle in Corporate AAA Bond Yields formed a major low in July 2016 which ordinarily translates into a new sustained half-cycle uptrend of 30+/- years – but the COVID-19 coronavirus pandemic has forced more monetary accommodation from central banks, prolonging the previous 30-year cycle downtrend even longer – but the March ’20 lows are finally secure, confirming a new 30+ year uptrend for interest rates has begun.
Inflation – U.S. CPI is running at 40-year highs at 7.5% per cent. However, this is perfectly in-line with our long-term ‘Inflation-Pop’ cycle that peaks around 2024-27. CPI is completing a five wave impulse uptrend from the March ’20 pandemic low indicating a pause in the in inflationary pressures for the remainder of this year. US10yr Real Yields have begun to trend higher from last year’s low of -1.190%. Whilst the outlook continues rising inflationary pressures, a shorter-term correction is due to begin. US10yr TIPS also trending higher over the medium/long-term although a dip shorter-term. US10yr Breakeven Inflation Rate is forecast lower during next several months from 2.493 to 1.723+/- again indicating a pause in inflation expectations. The U.S. Fed Funds rate is currently at the 0.00-0.25% per cent band but is pricing-in several rate hikes this year as the Federal Reserve change to a tightening policy.
This is WaveTrack’s most comprehensive Currencies and Interest Rates Video Outlook to date. Check out the table of contents below and if you are trading Currencies – don’t miss it!
We invite you to take this next step in our financial journey with us – video subscription details are below – just follow the links and we’ll see you soon!
Most sincerely,
Peter Goodburn
Founder and Chief Elliott Wave Analyst
WaveTrack International
What you get!
Contents: 150 charts | VIDEO DURATION: nearly 3 hours 30 mins.
The contents of this CURRENCIES & INTEREST RATES VIDEO include Elliott Wave analysis for:
Currencies (101 charts):
• US$ Index + Cycles
• Euro/US$ + Cycles
• Stlg/US$
• US$/Yen
• US$/CHF
• US$/NOK
• US$/SEK
• AUD/US$
• US$/CAD
• NZD/US$
• Euro/Stlg
• Euro/NOK
• Euro/Yen
• Euro/CNY
• Stlg/YEN
• Stlg/NOK
• Stlg/ZAR
• AUD/YEN
• AUD/Renminbi
• AUD/NZD
• Asian ADXY
• US$/Renminbi
• US$/KRW
• US$/SGD
• US$/INR
• US$/TWD
• USD/THB
• US$/MYR
• US$/IDR
• US$/PHP
• USD/BRL
• USD/RUB
• US$/ZAR
• US$/MXN
• US$/TRY
• US$/PLZ
• Bitcoin
• Ethereum
Interest Rates (49 charts):
• US CPI
• US PCE
• US10yr Real Yield
• US30yr Yield + Cycles
• US10yr Yield + Cycles
• US5yr Yield
• US2yr Yield
• US2yr-10yr Yield Spread
• US10yr-30yr Yield Spread
• 3mth EuroDollar-US10yr Yield Spread
• Comparison US10-DE10yr vs S&P 500
• US10yr TIPS Break Even Inflation Rate
• US10-DE10yr Yield Spread
• DE10yr Yield
• ITY10yr Yield
• Italy10-DE10yr Yield Spread
• Australia 10yr Yield
• Japan 10yr Yield
How to buy the Currencies + Interest Rates Video Outlook 2022
Simply contact us @ services@wavetrack.com to buy the CURRENCIES + INTEREST RATES Video Outlook 2022 for USD 48.00 (+ VAT where applicable) or alternatively our Triple Video Offer for USD 96.00 (+ VAT where applicable) – Review the content of WaveTrack Stock Indices Video PART I here and the Commodities Video PART II here.
*(additional VAT may be added depending on your country – currently US, Canada, Asia have no added VAT but most European countries do)
We’re sure you’ll reap the benefits – don’t forget to contact us with any Elliott Wave questions – Peter is always keen to hear you views, queries and comments.
Visit us @ www.wavetrack.com
Russia RTS Index Update!
by WaveTrack International| February 25, 2022 | No Comments
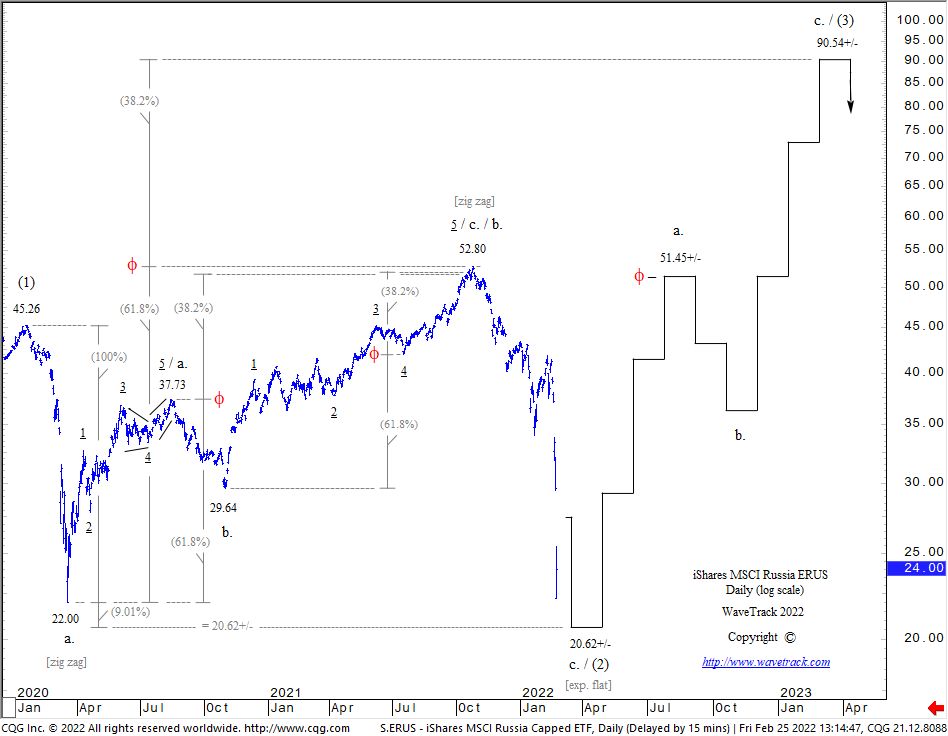
Fig #1 – Russia RTS Index financial forecast by www.wavetrack.com
Russia RTS Plunge Over!
The Russia RTS Index shows that intermediate wave (2) is approaching a downside completion as an a-b-c Elliott Wave expanding flat pattern (ETF symbol ERUS) – see Fig #1.
The larger uptrend is amazing!
Special Coverage of the Russia RTS Indices in tonight’s Elliott Wave Compass Report
See tonight’s EW-Compass Report for more details.
COMMODITIES VIDEO OUTLOOK 2022 Part II
by WaveTrack International| January 28, 2022 | No Comments

We’re pleased to announce the publication of WaveTrack’s annual 2022 video outlook of medium-term ELLIOTT WAVE price-forecasts. Today’s release is PART II, COMMODITIES – Part I was released last month and Part III will be published in late-February
• PART I – STOCK INDICES – out now!
• PART II – COMMODITIES – out now!
• PART III – CURRENCIES & INTEREST RATES – coming soon!
Inflation-Pop within Deflationary Cycle
Commodities have been the largest contributor of rising inflationary pressures over the last year as Consumer Prices (CPI’s) from around the world surge to 30-year highs – in the U.S., headline CPI has recently printed levels to 7.1% whilst Fed Funds have remains stuck at the Fed’s current all-time-low of 0.00%-0.25% per cent – US10yr yields only 1.900%.
These huge price rises have been expected though, part of the second stage of the ‘Inflation-Pop’ cycle that began from the grand ‘Re-Synchronisation’ lows of 2016. Many commodities like Copper forged secondary lows at the beginning of 2016, others like Crude/Brent oil joined the inflation-pop cycle much later and from much lower, comparable levels, at the pandemic lows of March ’20. But all have one thing in common – these price advances, although huge, are part of a much longer term ‘deflationary cycle’ that is balancing the end of the ‘Commodity Super-Cycle’ that unfolded from the Great Depression lows of 1932 into the orthodox end in 2006-08.
Rising Inflationary Pressures – Food & Energy
Recent investment bank surveys show the biggest concern amongst large asset funds is rising inflationary pressures – it’s not surprising the Federal Reserve having seen CPI above 7.0% per cent have panicked, reversing policy that inflation was transitory into its current persistent dialogue. It seemed obvious last year the Fed would end up chasing their own tail in a catch-up situation of rising inflation whilst holding back on interest rate rises – we now see the central bank unwinding its bond-buying programme in preparation for interest rate rises in March this year. With commodities expected to undergo severe corrections this year, inflationary pressures are forecast to pull back from recent highs prior to resuming higher in 2023/24. See fig #1
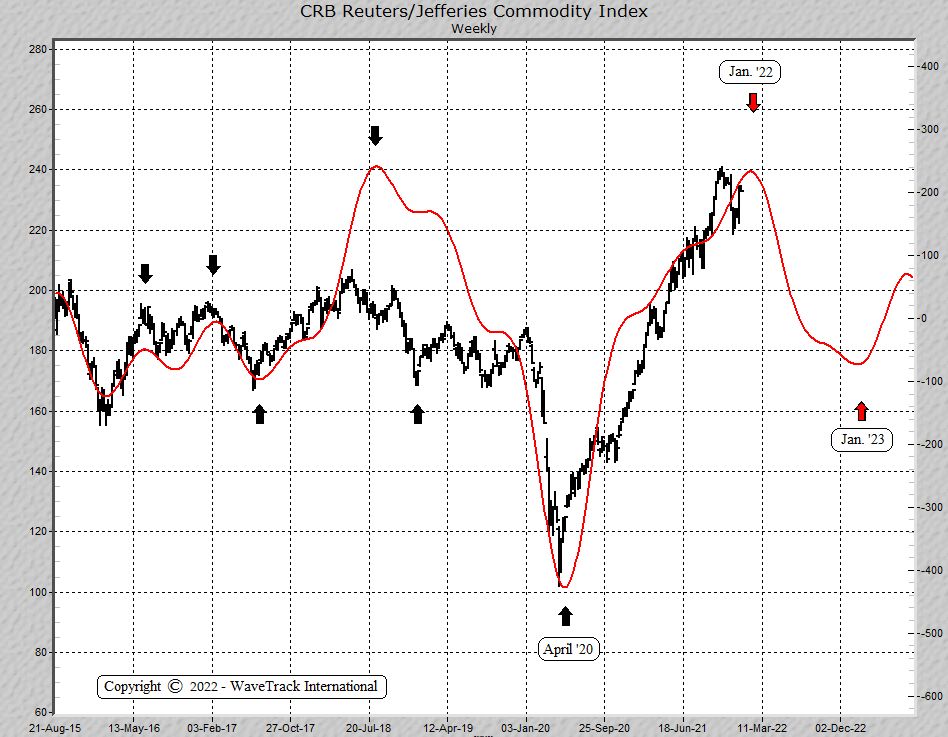
Fig #1 – CRB Index Cycle by WaveTrack International
Commodity Correction During Next 6-8 Months
Whilst commodity prices have surged higher from the pandemic lows of March ’20, many have unfolded higher into five wave impulse patterns, either ending last May ’21 like Copper, or into more recent highs like Crude/Brent oil, depending on the commodity. These disparative highs are not uniform which makes it difficult to pinpoint when exhaustion tops occur, but when some underperform, i.e. Copper pulls lower from last year’s highs whilst Crude/Brent oil make higher-highs, this sets-up bearish divergences across many technical signals – a bearish warning of impending price declines.
Rare Earth Metals
Rare Earth Metals have seen exponential price rises from pandemic lows – this report features price forecasts for the VanEck Vectors Rare Earth ETF and analysis of MP Materials Corp. who owns and operates he Mountain Pass mine, the only operating rare earth mine and processing facility in the United States. See fig #2
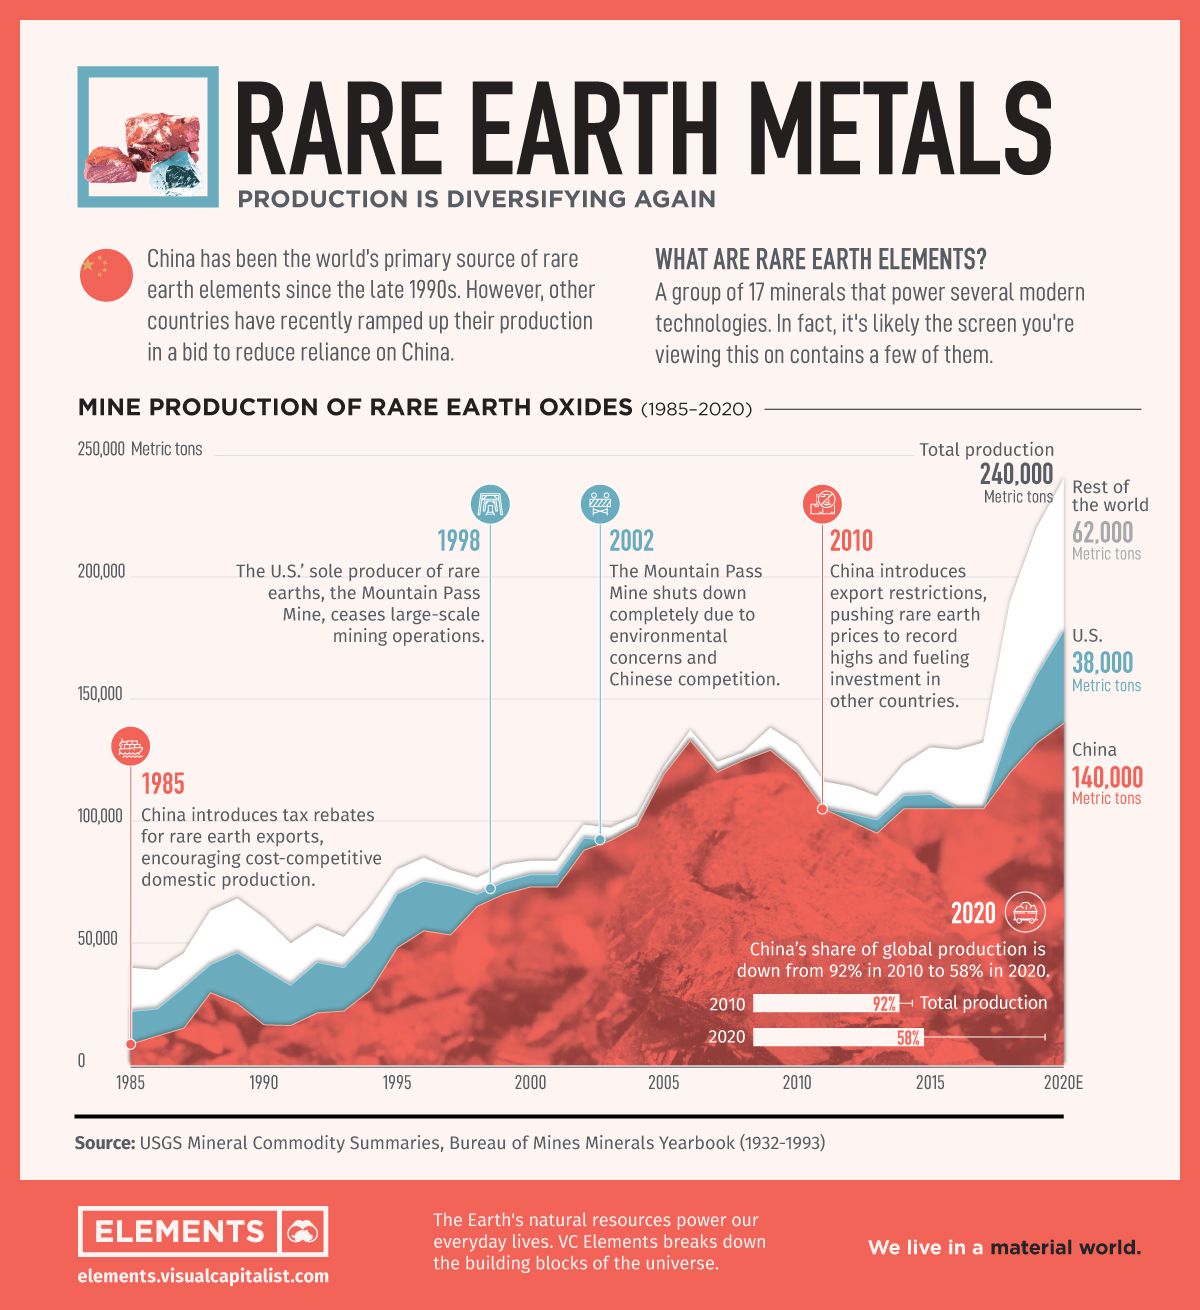
Fig #2 – Rare Earth Metals – Worldwide by courtesy of Elements.visualcapitalist.com
Commodities Video Part II
Contents: 125 charts
Time: 2 hours 47 mins.
• US PCE Inflation
• US CPI
• Food and Agriculture Index
• Lumber
• CRB-Cash index
• US Dollar index + Cycles
• Copper + Cycles
• Aluminium
• Lead
• Zinc
• Nickel
• Tin
• XME Metals & Mining Index
• BHP-Billiton
• Freeport McMoran
• Antofagasta
• Anglo American
• Glencore
• Rio Tinto
• Teck Resources
• Vale
• Gold + Cycles
• GDX Gold Miners Index
• Newmont Mining
• Amer Barrick Gold
• Agnico Eagle Mines
• AngloGold Ashanti
• Fresnillo Silver
• Silver + Cycles
• Silver/Copper Correlation
• XAU Gold/Silver Index
• Gold-Silver Ratio
• Gold/Platinum Spread
• Platinum
• Palladium
• Rare Earths
• Iron Ore
• Uranium
• Crude Oil + Cycles
• Brent Oil
• XLE Energy SPDR
• XOP Oil and Gas Index
• Natural Gas
How can you purchase the video?
1. Contact us @ services@wavetrack.com and ask for a PayPal payment link (please state if you like to purchase the Commodities Single video or the Triple Video?).
2. Ask for an individual credit card payment link (in case you do not with to pay via PayPal).
*(additional VAT may be added depending on your country – currently US, Canada, Asia have no added VAT but most European countries do)
We’re sure you’ll reap the benefits – don’t forget to contact us with any Elliott Wave questions – Peter is always keen to hear you views, queries and comments.
Visit us @ www.wavetrack.com
We’re sure you’ll reap the benefits. Don’t forget to contact us with any Elliott Wave questions. Our EW-team is always keen to hear your views, queries, and comments.
Visit us @ www.wavetrack.com
STOCK INDICES VIDEO OUTLOOK 2022 Part I
by WaveTrack International| December 29, 2021 | No Comments
STOCK INDICES VIDEO OUTLOOK 2022 Part I/III
SEVERE CORRECTION in 2022
Post-Pandemic Advance Set to Take a Pause within Final Stage of Secular-Bull Uptrend – Risk of minus -30 to -40% Correction in Benchmark Indices during next 6-8 Months – Inflationary Pressures Ease but Not Over – European Indices set for Significant Correction – Technology/FANGS+ Undergo Severe Sell-Off in 2022 – Secular-Bull Uptrend Peak On-Track for 2023-24
Stock Indices Video Update
The post-pandemic advances from the March ’20 lows are reaching interim peaks in their overall development within the final stages of the secular-bull uptrend. These interim uptrends have in many cases, already ended into November’s highs. However, there are other indices/sectors that can stretch to higher-highs during the next month, into early new year, 2022. This largely depends on asset allocation and rotation, but any higher-highs are likely to be short-lived.
A repeat of 2020’s sell-off from the January/February peaks are expected this year, in 2022. Furthermore, declines in U.S./European indices are expected to undergo corrections of between minus -30% to -40% per cent. This is more limited in many Emerging Market indices and especially China where declines are relatively modest by comparison.
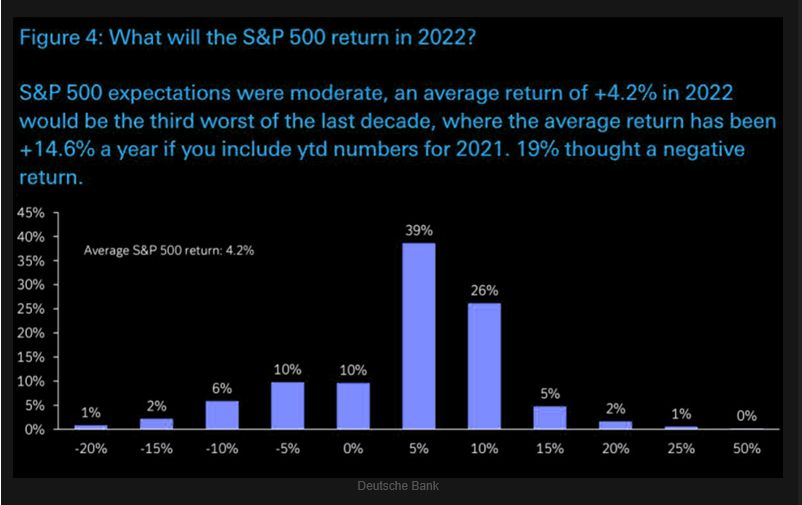
Fig #1 – What will the SP500 return in 2022? Source: Deutsche Bank
Deutsche Bank conducted a survey to its clients, asking what expected return for the SP500 is forecast for 2022 – see fig #1. The result predominantly shows most, 39% expects a positive return for next year at +5% per cent – 26% expects a gain of +10% per cent and 5% per cent expects a gain of 15% per cent. Contrastingly, 26% expect declines of between 0.0% or max. -10% per cent.
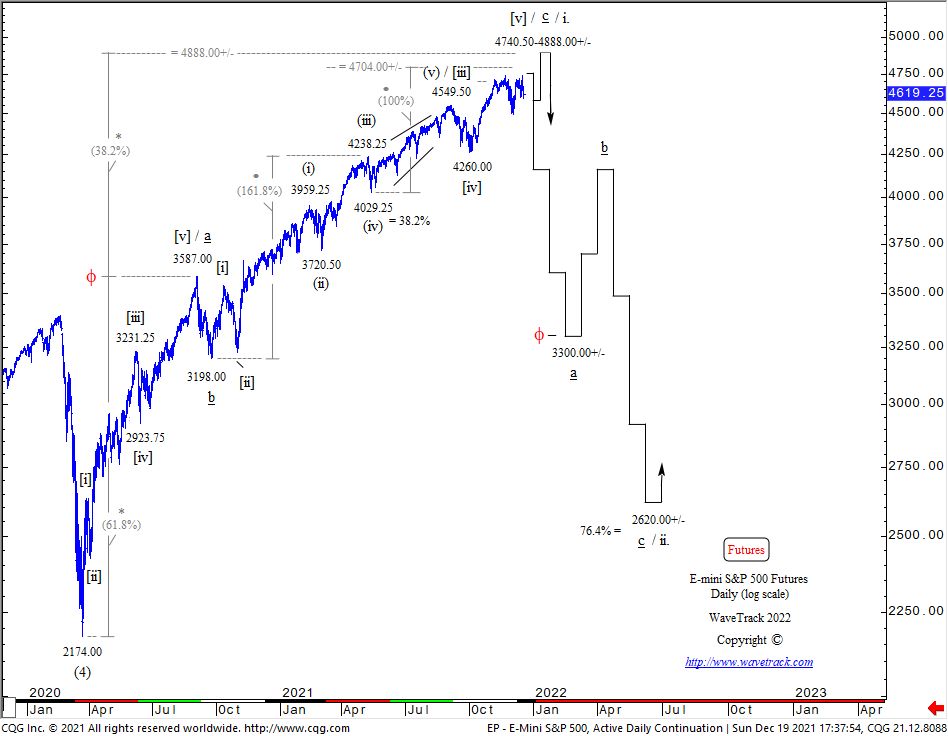
Fig #2 – E-Mini SP500 Futures – Daily by WaveTrack International
The predominant bullish calls are what we’d expect near the top of a stock market uptrend. Mainly, from a contrarian standpoint, it heightens the probability of a correction next year. However, it also shows the current complacency in the market – no one is expecting a correction of between minus -30% to max. -40% as Elliott Wave analysis predicts – see fig #2.
Inflation
Rising inflationary pressures have dominated financial markets during 2021 and this is expected to continue during the first month or two into the new year, 2022. The headline U.S. Consumer Price Index has surged higher to 6.8% in November with Food rising by 6.1% year-on-year whilst Energy has risen by 33.3% per cent. However, all these are expected to stage an interim peak during the next month or two, then beginning corrective declines. Rising inflationary pressures don’t resume higher until Q3/Q4 2022.
Annual 2022 Forecasts – Report/Video
Our annual 2022 Stock Indices report/video is PART I of a three-part trilogy series of Elliott Wave analysis, an outlook for the next year and into the final stages of the secular-bull ‘Inflation-Pop’ cycle.
We’ll be taking a close introspective look across many U.S. indices, the large-cap and small-cap trends. But also across many different sectors too including the FANGS+ index, U.S./European Banks, Biotechnology, Technology and many more. We’re also updating some fascinating Elliott Wave counts for several economic data points too, including Consumer Sentiment, Consumer Confidence, Price to Book Ratio, Price-Sales Ratio! There’s some interesting results from the recent upsurge in inflationary pressures too!
New Stock Indices 2022 Video – PART I/III
This ANNUAL 2022 VIDEO UPDATE for STOCK INDICES is like nothing you’ve seen anywhere else in the world. It’s unique to WaveTrack International, how we foresee trends developing through the lens of Elliott Wave Principle (EWP) and how its forecasts correlate with Cycles, Sentiment extremes and Economic data trends.
We invite you to take this next step in our financial journey with us – video subscription details are below – just follow the links and we’ll see you soon!
Most sincerely,
Peter Goodburn
Founder and Chief Elliott Wave Analyst
WaveTrack International
Contents Stock Indices Video Outlook 2022
Charts: 98 | Video: 2 hours 40 mins.
Read more «STOCK INDICES VIDEO OUTLOOK 2022 Part I»
Currencies + Interest Rates Mid-Year Video Update 2021
by WaveTrack International| August 10, 2021 | No Comments
Currencies + Interest Rates Mid-Year Video Update 2021 | PART III/III
US$ Dollar’s Long-Term Trend Remains Downwards basis 15.6-Year Cycle – Shorter-Term Correction unfolding Higher Since January and Set to Continue until October/November – Euro/US$ Corrective Downswing to 1.1320+/- with all G10’s in Corresponding Corrections – Commodity Currencies set to Weaken during Next Several Months – Asian Currencies in US$ Dollar Corrections – Interest Rates Finishing Counter-Trend Downswings but Risks of Continuation – Inflation TIPS in Correction – Spreads indicate new Widening Phase has begun in Dollars and Euros – Italy’s Yields still Trending Lower – Japan’s JPY10yr Continuing Lower.
INCLUDES ANALYSIS ON MAJOR US$ DOLLAR PAIRS/CROSSES – ASIAN/EM CURRENCIES – MEDIUM-TERM CYCLES – LONG-DATED YIELDS US/EUROPE/JAPAN + SPREADS
We’re pleased to announce the publication of WaveTrack’s Mid-Year 2021 trilogy video series of medium-term ELLIOTT WAVE price-forecasts. Today’s release is PART III, CURRENCIES & INTEREST RATES – Parts I & II were released during the last month – see below for information.
• PART I – STOCK INDICES – out now!
• PART II – COMMODITIES – out now!
• PART III – CURRENCIES & INTEREST RATES – out now!
Review – H1 2021
Economies have reopened after lengthy lock downs last year. Starting with an initial growth rebounding by double-digits as pent-up demand flows through order books in manufacturing and more recently, the services industry. This year’s numbers have been accompanied by surging inflationary pressures which reached peaks last March (2021). Although at the time, financial markets were positioning for continued price rises, interest rate rises and a weakening US$ dollar. However, the reality was quite the opposite.
In this year’s annual report, we commented – ‘…we know that such statistics can be misleading when it comes to timing imbalances that eventually lead to directional change, but sentiment data like this can be used in conjunction with Elliott Wave analysis which we can confirm shows that dollar oversold condition is about to change with significant corrective rallies already underway. The US$ dollar index is forecast up to 95.85+/- over the next 5-6 months, maybe even higher’.
US$ Dollar Index Performance
The US$ Dollar Index has certainly put in a base-line low last January at 89.21 and it’s been engaged in a counter-trend rally since, trading so far to 93.43. This rally is far from over, where upside targets of 95.85+/- are little changed, currently at 96.15+/-.
Interest Rates Performance
And for Interest Rates, a pause in those inflationary pressures was forecast basis analysis in the US10yr treasury yield and the Inflation TIPS, commenting – ‘…Whilst the long-term trends show a new 30+ year uptrend cycle for global interest rates, including treasury yields began from before last year’s COVID-19 pandemic lows, it is due to take a breather over the next 5-6 months…It’s necessary for a counter-trend 2nd wave downswing to now unfold. This suggests a temporary unwinding of the ‘Reflation-Trade’.
Exactly right! – the US10yr yield hit a peak last March at 1.774% per cent and has since traded down to .131%. So what can we expect next?
EW-Forecasts H2 2021
A lot of the normal correlations between the different asset classes have broken down this year. At the time of major turning points last year, in March’s ’20 pandemic highs/lows, the US$ Dollar hit a peak at 102.99 whilst stock markets like the benchmark S&P 500 traded to a low of 2191.86. The US$ dollar then declined into a five wave impulse pattern, ending last January ’21 at 89.21 and since trading higher into a correction. Yet, U.S. stock indices have yet to complete their corresponding advances although they’re expected at the end of August. But that means the normal correlation between these two asset classes have diverged for almost 8 months – see Fig #1.
Fig #1 – US Dollar Index – Composite Cycle – Monthly by WaveTrack International
Interest Rates
Interest rates bottomed into the March ’20 pandemic lows too with the US10yr yield hitting historical lows of 0.378% whilst the S&P 500 hit lows at 2191.86. But again, this relationship began to break down last March when the US10yr yield ended a its uptrend at 1.774 then declined earlier this month to 1.131 even though the S&P 500 has kept trending higher.
There’s also been a disruption in the way rising inflationary pressures have unfolded this year, in 2021. Investors surveyed last April by Bank of America showed 93% per cent were expecting the continuation of inflationary pressures – since then, rising food and agriculture prices (see PART II Commodities Report here) have exacerbated inflationary perceptions with lagging gains but with treasury yields declining over the past four months. However, that sentiment figure has now dropped to only 22% per cent.
The real difficulty in price forecasting is this divergence in ‘normal’ correlations. When they break down, it’s sometimes tricky to know how deep corrections can unfold if comparisons are removed from the equation – see Fig #1 – #2. This means that Elliott Wave patterns must be relied upon even if it sometimes doesn’t make sense.
Fig #2 – Corporate 30yr Bond Yield – Cycle Analysis by WaveTrack International
What would happen next if interest rates bottom now completing those corrections?
Is that bullish or bearish for stock markets? And the next direction for stock markets remains critical in forecasting the US$ dollar’s next moves. Hypothetically, should stock markets correct by -30% per cent, as we see a heightened risk, that certainly translates into a higher US$ dollar but what about interest rates? Do they attract safe-haven buying, consistent with historical precedent? Or do interest rates surge higher because of another round of rising inflationary pressures, sending stock markets lower. You see the point – the recent breakdown in correlations makes it difficult to be sure.
Of all the movements in stock markets, commodities, currencies and interest rates, we can say with confidence that the US$ dollar is rated as the highest outcome basis the current Elliott Wave analysis depicting January’s correction continuing higher until October/November.
We’re updating some amazing Elliott Wave forecasts for Currencies and U.S. interest rates, US30yr, US10yr, US05yr and even US02yr together with a schematic look at several spread relationships with European rates not forgetting upside targets for the US10yr Inflation Tips and our attempt to solve this financial riddle – it’s a must-see!
We invite you to take this next step in our financial journey with us – video subscription details are below – just follow the links and we’ll see you soon!
Most sincerely,
Peter Goodburn
Founder and Chief Elliott Wave Analyst
WaveTrack International
What you get!
Contents: 127 charts | VIDEO DURATION: 2 hours 34 mins.
The contents of this CURRENCY & INTEREST RATES VIDEO include Elliott Wave analysis for:
Currencies (92 charts):
• US$ Index + Cycles
• Euro/US$ + Cycles
• Stlg/US$
• US$/Yen
• US$/CHF
• US$/NOK
• US$/SEK
• AUD/US$
• US$/CAD
• NZD/US$
• Euro/Stlg
• Euro/CHF
• Euro/NOK
• Euro/Yen
• Euro/AUD
• Euro/CNY
• Stlg/YEN
• Stlg/CHF
• Stlg/NOK
• Stlg/ZAR
• Stlg/AUD
• AUD/NOK
• CAD/NOK
• AUD/CAD
• AUD/NZD
• Asian ADXY
• US$/Renminbi
• US$/KRW
• US$/SGD
• US$/INR
• US$/TWD
• USD/THB
• US$/MYR
• US$/IDR
• US$/PHP
• USD/BRL
• USD/RUB
• US$/ZAR
• US$/MXN
• US$/TRY
• US$/PLZ
• Bitcoin
• Ethereum
Interest Rates (37 charts):
• US30yr Yield + Cycles
• US10yr Yield + Cycles
• US5yr Yield
• US2yr Yield
• US2yr-10yr Yield Spread
• US10yr-30yr Yield Spread
• 3mth EuroDollar-US10yr Yield Spread
• Comparison US10-DE10yr vs S&P 500
• US10yr TIPS Break Even Inflation Rate
• US10-DE10yr Yield Spread
• DE10yr Yield
• ITY10yr Yield
• JPY10yr Yield
How to buy the Currencies + Interest Rates Mid-Year Video Update 2021
Simply contact us @ services@wavetrack.com to buy the CURRENCIES + INTEREST RATES Video Outlook 2021 for USD 48.00 (+ VAT where applicable) or alternatively our Triple Video Offer for USD 96.00 (+ VAT where applicable) – Review the content of WaveTrack Stock Indices Video PART I here and the Commodities Video PART II here.
*(additional VAT may be added depending on your country – currently US, Canada, Asia have no added VAT but most European countries do)
VIMEO – For clients who wish to purchase our video directly online – the video will be available within this week on VIMEO! We will publish the vimeo link here and on our twitter account!
We’re sure you’ll reap the benefits – don’t forget to contact us with any Elliott Wave questions – Peter is always keen to hear you views, queries and comments.
Visit us @ www.wavetrack.com
New Video! COMMODITIES CORRECTION AHEAD
by WaveTrack International| July 14, 2021 | No Comments
COMMODITY CORRECTION AHEAD’ – ‘PAUSE WITHIN INFLATION-POP’ CYCLE
We’re pleased to announce the publication of WaveTrack’s annual 2021 mid-year video updates of medium-term ELLIOTT WAVE price-forecasts. Today’s release is PART II, COMMODITIES – Part I was released last month and Part III will be published in late-July
• PART I – STOCK INDICES – out now!
• PART II – COMMODITIES – out now!
• PART III – CURRENCIES & INTEREST RATES – coming soon!
What is the Commodity Super-Cycle?
The Commodity Super-Cycle beginning from the Great Depression lows of year-1932 ended in 2006-08. Since then, a multi-decennial corrective downswing has begun a new deflationary era but with pockets of rising inflationary pressures.
Commotidies – Rising Inflationary Pressures
One of those pockets of rising inflationary pressures resumed in early 2016 but gained pace this year in 2021. However, it is set to surge higher through to a final peak due in 2023/24. This is the final phase of the ‘Inflation-Pop’ cycle.
But like all uptrends, including inflation, they are punctuated by intervening corrections – one of those corrections is set to begin NOW! Commodities have traded exponentially higher since the pandemic low of March ’20 but have reached interim upside price levels. Especially, since sentiment is euphoric whilst Elliott Wave patterns show a uniform completion to last year’s advances. This can be seen in Base Metals, Energy but also in Agriculture and Food. A 6-month correction lies directly ahead. Only afterwards does the inflation/price uptrends resume through 2022/2024.
Base Metals
A 6-month corrective downswing is about to get underway. Copper and Aluminium have seen the far greater advances from the pandemic lows of March ’20 relative to the other base metals. Copper has just completed its intermediate degree 3rd wave uptrend with a 4th wave correction of -29% per cent underway. Aluminium is approaching a peak for primary wave A with wave B’s correction -24% per cent set to begin. Lead is completing its 1st wave uptrend with a significant corrective pullback set to begin lasting through year-end, a decline of minimum -18% per cent. More about Zinc, Nickel and Tin prices in our latest EW-Commodities Video!
Base Metal Miners
The benchmark XME Metals & Mining index (ETF) is engaged in a five wave diagonal uptrend from the 2016 lows. A correction is expected over the next several months within its 3rd wave of -40% per cent. WaveTrack’s Commodities Video contains Elliott Wave charts of BHP Billiton, Freeport McMoran, Antofagasta, Anglo American, Kazakhmys Copper, Glencore, Rio Tinto, Teck Resources and Vale explaining in details what the next price move might be.
Precious Metals
Gold is set to continue trading lower from last August’s high of 2072.12 as part of primary wave 4’s correction. Downside targets remain towards 1600.00+/-. Gold continues to trade in negative-correlation to the US$ dollar index which is itself pushing higher from January’s low into a corrective rally, lasting into October/November. Longer-term upside targets remain towards 2472.00+/-. Silver continues to trade into a sideways 4th wave triangle from last August’s high of 29.86 – next downside targets remain towards 21.74+/-. Longer-term, upside targets remain towards 38.60+/-. Alternate counts are more bullish, towards 65.75+/-. Get insights into Platinum and Palladium forecasts in WaveTrack’s EW-Commodities Video.
Precious Metal Miners
The benchmark GDX Gold Miners index continues its corrective decline from last August’s high of 45.78 – downside targets towards 27.87+/-. XAU Gold/Silver index is set to extend last year’s correction targeting levels towards min. 116.17+/-, max. 109.37+/-. This corrective theme is repeated for many other gold and silver miners including Newmont Mining, Barrick Gold, Agnico Eagle, AngloGold Ashanti and Fresnillo Silver. More information about the Precious Miners long-term outlook can be found in this latest EW-Commodities Video!
Energy
The star performers in the commodity sector have been Crude and Brent oil. More about Crude Oil, Brent oil, XLE Energy and XOP Oil & Gas indices prices in our latest EW-Commodities Video!
Monetary & Fiscal Stimulus
Monetary and fiscal stimulus remains at unprecedented historical levels – the U.S. leads the world in both aspects – the Federal Reserve has bought $982 billion of mortgage bonds since March 2020, and currently plans to keep buying at least $40 billion each month. Those purchases, along with the Fed’s monthly purchases of $80 billion of treasury debt aims to hold down long-term borrowing costs to stimulate the economy as it recovers from the effects of the pandemic. See graphics Fig #1 – #3.
Fig #1 – Covid Stimulus Package – Source: Statista
Fig #2 – Monetary Bazooka – Source: Goldman, J.P. Morgan, Reuters, Ritvik Carvalho, Tommy Wilkes
Fig #3 – Fiscal Firepower – Source: Goldman, J.P. Morgan, Reuters, Ritvik Carvalho, Tommy Wilkes
Meanwhile, U.S. president Joe Biden has paved the way for his fiscal stimulus programme of $1.9 trillion dollars last March and just last month, has signed off a new infrastructure bill of $1.2 trillion dollars which is designed over an eight year period – it includes $109bn for roads and bridges, $66bn for railways, $49bn for public transport and $25bn for airports – that’s bullish for commodities!
The president wants to enact another, roughly $6tn spending package that would roll in his party’s priorities on climate change, education, paid leave and childcare benefits. And that’s just America! There are similar programmes all over the world, including Europe, China, Japan and elsewhere. Japan’s stimulus is so out of control, it now amounts to 56.09% per cent of its total GDP – unsustainable!
No wonder inflationary pressures are being stoked higher.
Inflationary Pressures Inevitable
The Federal Reserve has been watching how long-dated treasury yields have been trending strongly higher this year, widening the curve as it attempts to maintain its low-interest-rate policy. It had made several statements over the last months, saying inflationary pressures were ‘transitory’ in an attempt to halt the rise. The only other option would be to begin ‘yield curve control’ like the Bank of Japan – not desirable at all. The markets didn’t believe a word of this with bond fund managers increasing their short positioning as the latest Personal Consumption Expenditures (PCE) index, the key measure of the Fed’s inflation gauge surged higher.
US10yr treasury yields peaked in March at 1.774% and have been declining since to 1.245%, forcing bong managers to short-cover their positions amid a re-assessment of the inflation prospects. Ironically, in June’s Federal Reserve meeting, Chairman Jerome Powell announced a policy change, making a U-turn on inflation estimates, employment, the timing of a tapering of bond purchases and interest rate hikes. The Fed raised its headline inflation expectation to 3.4%, a full percentage point higher than the March ’21 projection. Therefore, it also shortened the time frame of interest rate hikes indicating two increases by end-2023. See graphic here:
Fig #4 – Stronger Inflation, lower unemployment – Source: Federal Reserves Summary of Economic Projections
Yes, inflationary pressures are inevitable and likely to continue trending higher right into the final peak of the inflation-pop cycle due in 2023/24. As a result, a shorter-term a pause also seems inevitable basis the Elliott Wave patterning across several key commodities like Copper, Crude oil, even Agricultural commodities and Foodstuffs.
Bullish Sentiment
Winding the clock back to the time when the coronavirus pandemic hit, commodities were under-invested by fund managers globally – see graphics here:

Fig #5 – Global Fund Manager Survey – Source: BofA

Fig #6 – Global Fund Manager Survey June 2021 – Source: BofA
In the March 2020 Global Fund Manager survey conducted by Bank of America, commodity exposure was shown to be at the lowest levels not seen since 2015 with energy in last position in the asset table. That certainly turned out to be a contrarian bullish signal. Fast-forward to today, and you’ll see commodity exposure has flipped 180 degrees and is now at the summit of the league table. From an Elliott Wave perspective, that’s another contrarian warning signal to expect a potential dip in prices over the next several months.
New Commodities Mid-Year 2021 Video – PART II/III
We’ve amassed over 109 commodity charts from our EW-Forecast database in this mid-year 2021 video. Each one provides a telling story into the way Elliott Wave price trends are developing as a ‘COMMODITY CORRECTION AHEAD’ with a ‘PAUSE WITHIN INFLATION-POP’ CYCLE’ development.
We invite you to take this next step in our financial journey with us. Video subscription details are below. Just follow the links and we’ll see you soon!
Most sincerely,
Peter Goodburn
Founder and Chief Elliott Wave Analyst
WaveTrack International
Commodities Video Part II
Contents: 109 charts
Time: 2 hours 42 mins.
• US PCE Inflation
• US Real Yield
• Food and Agriculture Index
• Lumber
• CRB-Cash index
• US Dollar index + Cycles
• Copper + Cycles
• Aluminium
• Lead
• Zinc
• Nickel
• Tin
• XME Metals & Mining Index
• BHP-Billiton
• Freeport McMoran
• Antofagasta
• Anglo American
• Kazakhmys Copper
• Glencore
• Rio Tinto
• Teck Resources
• Vale
• Gold + Cycles
• GDX Gold Miners Index
• Newmont Mining
• Amer Barrick Gold
• Agnico Eagle Mines
• AngloGold Ashanti
• Fresnillo Silver
• Silver + Cycles
• Silver/Copper Correlation
• XAU Gold/Silver Index
• Gold-Silver Ratio
• Gold/Platinum Spread
• Platinum
• Palladium
• Uranium
• Crude Oil + Cycles
• Brent Oil
• XLE Energy SPDR
• XOP Oil and Gas Index
• Natural Gas
How can you purchase the video?
1. Contact us @ services@wavetrack.com and ask for a PayPal payment link (please state if you like to purchase the Commodities Single video or the Triple Video?).
2. Ask for an individual credit card payment link (in case you do not with to pay via PayPal).
3. Simply pay online via VIMEO. CAVEAT! Vimeo does not allow PDF uploads – if you like the PDF report with the charts you can still contact us @ services@wavetrack.com with your purchase email from VIMEO and we will, of course, make it avaiable to you.
VIMEO – COMMODITIES VIDEO purchase here!
Here is the link to our STOCK INDICES Mid-Year Video Part I published on vimeo.
We will publish the Vimeo link here and/or you can follow us on VIMEO now to receive future updates.
*(additional VAT may be added depending on your country – currently US, Canada, Asia have no added VAT but most European countries do)
We’re sure you’ll reap the benefits – don’t forget to contact us with any Elliott Wave questions – Peter is always keen to hear you views, queries and comments.
Visit us @ www.wavetrack.com
We’re sure you’ll reap the benefits. Don’t forget to contact us with any Elliott Wave questions. Our EW-team is always keen to hear your views, queries, and comments.
Visit us @ www.wavetrack.com
Stock Indices Mid-Year Video Update
by WaveTrack International| June 24, 2021 | No Comments

Stock Indices Video | PART I/III
STOCK INDICES – ‘INFLATION-POP’ Goes Mainstream! Post-Pandemic Advance Set to Take a Pause within Final Stage of Secular-Bull Uptrend – Risk of -30-40% Correction in Benchmark Indices during next 6-Months – Inflationary Pressures Ease but Not Over – European Indices set for Significant Correction – EuroStoxx Banks Take a Hit – Small-Cap’s Suffer – Technology/FANGS+ Decline but Outperforming with Biotechnology – EM’s Correct as US$ Dollar Revives
Includes Updated SENTIMENT & ECONOMIC INDICATOR STUDIES
We’re pleased to announce the publication of WaveTrack’s Mid-Year 2021 video updates of medium-term ELLIOTT WAVE price-forecasts. Today’s release is PART I, STOCK INDEX VIDEO – Parts II & III will be published during July/August.
• PART I – STOCK INDICES
• PART II – COMMODITIES
• PART III – CURRENCIES & INTEREST RATES
Elliott Wave Stock Indices Forecast – Highlights
Stock Indices – Shorter-term U.S.
Upside rallies in the S&P 500, Dow, Russell 2000 and Nasdaq 100 indices from the post-pandemic March ’20 lows as intermediate wave (5) have so far unfolded into three wave a-b-c zig zag patterns. Risk of completing 1st waves within ending-type diagonals with 2nd wave corrections between -30% to max. -40% per cent over next 6-month period. Alternate bullish counts otherwise depict short-term correction of -10% per cent followed by higher-highs.
Stock Indices – Shorter-term Europe
The post-pandemic advance of March ’20 began a secondary A-B-C zig zag advance within the double pattern in upward progress from the financial-crisis lows of 2008-09. Wave A ended an initial advance into the July ’20 high – wave B is unfolding into an expanding flat with the high reached now. Final downswing beginning from current levels. Risk of -30% per cent decline over next 6-month period.
Stock Indices – Emerging Markets
MCSI Emerging Market index has traded higher from post-pandemic lows of March ’20 into an a-b-c zig zag. This is consistent within its 3rd wave double zig zag advance of the ending-type diagonal that began its uptrend in early-2016. An x wave correction is forecast lower by -30% per cent over next 6-month period.
Stock Indices – Global/Asia
Hang Seng is same pattern as MSCI EM index, trending higher as and ending-type diagonal but downside risks of correction during next several months. The Shanghai Composite underperforming but expected to outperform next year in 2022 once shorter-term correction has completed during next several months. Bovespa trending higher from post-pandemic lows as developing a-b-c zig zag. Corrective declines over next several months. Russia’s RTS vulnerable to a corrective dip but could outperform into year-end although dominant trend to the upside. India’s Sensex/Nifty 50 at risk of -30% to max. -40% per cent correction within post-pandemic uptrend. Singapore’s Straits Times underperforming but like China, expected to catch up next year. Taiwan SE index set for sizable correction within dominant uptrend. Australia’s All-Ord/ASX 200 set for a multi-month correction around -30% per cent before resuming to record highs afterwards. Nikkei 225 forecast lower over next several months by -35% per cent prior to resuming ending-type diagonal in advance from March ’20 lows.
Stock Indices Elliott Wave Forecast Review – H1 2021
The Annual 2021 report published last December (2020) forecast the continuing uptrend for global indices from the post-pandemic lows of March ’20. This was the final stage of the secular-bull uptrend that began from the financial-crisis lows of 2008-09.
Benchmark indices like the S&P 500 began 5th waves from the coronavirus lows with December’s report showing upside progress as a five wave expanding-impulse pattern. Shorter-term corrections were forecast as sentiment indicators reached levels of ‘extreme optimism’ but that never happened . Indices had already staged minor correction in September and were in the process of continuing more immediately higher. However, they never looked back and are still trading right now, at post-pandemic highs.
Sentiment Remains High
There’s been quite a few records broken in the process. Bank of America reports that the March ’20 recovery is the 3rd largest percentage rally on record – the other two were following major lows at the time of the Great Depression of 1932, in 1933 and 1936.
Their latest June ’21 Global Fund Manager Survey shows 76% per cent of investors believe the economy and the stock market is in an early-cycle ‘boom’ – see Fig #1. This reading is off-the-scale. By comparison, in previous peaks from the financial-crisis lows, readings were highest at 26-32% per cent. And even at the tops in early-2018!
Fig #1 – Global Fund Manager Survey – Source: Bank of America
Furthermore, that optimism is a straight-line advance from the post-pandemic low. However, it only went ‘exponential’ late last year when the northern-hemisphere summer holiday season ended. This is suggesting fund managers reassesses previous bearish call, turning very bullish from that time to present day.
The same survey reports net 75% per cent of fund managers expect a stronger economy which is just off a peak the previous month of 84% per cent. This high matches equivalent peaks in 1995, 2001, 2010 and 2014.
Now that’s really interesting!
Also, 68% per cent of fund managers don’t expect a recession until 2024 at the earliest – only 2% per cent expect a bear market in the next 6-months. Now that’s really interesting! The largest percentage of 47% believe a correction could unfold of less than <10% per cent and 6% per cent <20% per cent. That’s very skewed in optimism/complacency but only time will tell if this is a contrarian bear signal.
Elliott Wave Perspective
Certainly, from our Elliott Wave analysis, there’s a very high risk that markets will correct by more than the normal criteria of a -20% per cent for a ‘bear market’ but will instead decline between -30% to -40% per cent, depending on the index. If you want to understand the full story behind WaveTrack’s reasoning and analyis we invite you to watch our latest Stock Indices Video Part I/III.
New Stock Index Mid-Year 2021 Video – PART I/III
This MID-YEAR 2021 VIDEO UPDATE for STOCK INDICES is like nothing you’ve seen anywhere else in the world – it’s unique to WaveTrack International, how we foresee trends developing through the lens of Elliott Wave Principle (EWP) and how its forecasts correlate with Cycles, Sentiment extremes and Economic data trends.
We invite you to take this next step in our financial journey with us – video subscription details are below – just follow the links and we’ll see you soon!
Most sincerely,
Peter Goodburn
Founder and Chief Elliott Wave Analyst
WaveTrack International
Contents Stock Index Video Outlook 2021
Charts: 83 | Video: 2 hours 19 mins.
Read more «Stock Indices Mid-Year Video Update»
March ’20 Zig Zag Advances Completing 1st Wave Uptrends
by WaveTrack International| March 24, 2021 | No Comments
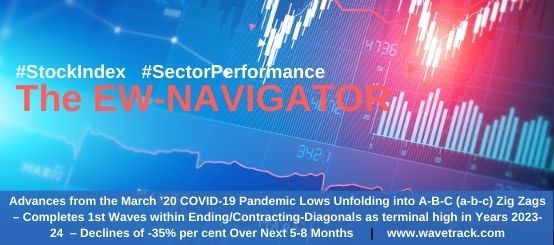
Advances from the March ’20 COVID-19 Pandemic Lows Unfolding into A-B-C (a-b-c) Zig Zags – Completes 1st Waves within Ending/Contracting-Diagonals as terminal high in Years 2023-24 – 2nd Wave Corrections Unfolding Now – Declines of -35% per cent Over Next 5-8 Months
Growth stocks
Growth stocks led the way during the early stages of the post-Coronavirus pandemic recovery of last year (2020). However, there’s since been a switch of outperformance in value stocks as growth got a bit stretched over the past couple of months. Rotation has also caused periods when large-caps lagged behind the outperforming small/mid-cap stocks/indices. Then there’s been a sudden underperformance in technology stocks/indices as long-dated treasury yields pushed strongly higher, making this industry less competitive relative to the broader market.
Critical Information
But amidst all of these uneven bumps, there’s emerged a defining Elliott Wave pattern development from the March ’20 COVID-19 lows. So many indices, large cap, mid-cap and small-cap together with several sectors alongside Emerging Markets/Asian indices have all unfolded into A-B-C zig zags. That’s really important. No, critical information because zig zags unfolding directionally higher following crash lows that formed last year can only be positioned in this case, within one type of larger Elliott Wave pattern – and that’s an ending-diagonal.
This month’s report examines how these A-B-C zig zags fit together into their larger degree ending-diagonal patterns across the major indices – see fig’s #1 & #2. But there’s a chilling outcome too. These zig zags are completing the 1st waves within developing five wave contracting-type diagonals which requires deep 2nd wave corrections. That could wipe out the current equity rally with declines of between -30% to -40% per cent over the next 5-8 month period.
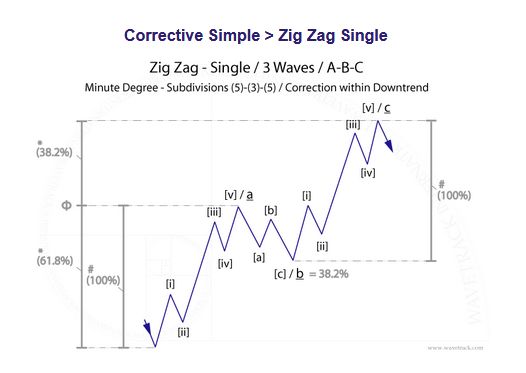
Fig #1 – Zig Zag Single
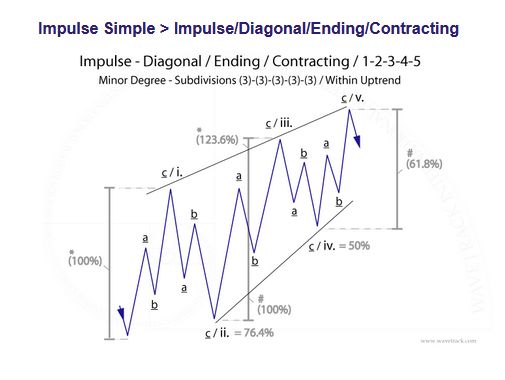
Fig #2 – Impulse Diagonal Ending Contracting by WaveTrack International
Such a decline could be triggered by any number of exogenous catalysts. For one thing, European countries are heading for a third-wave lockdown. The data backs-up the idea of a strong collapse in equities. Just look at the exponential gains in global equity flows so far this year which dwarfs anything every before – see fig #3. Exponential rises like this always turn into a parabolic curve, resulting in a deep downswing. That in itself could easily translate into a sharp downturn in evaporating fund allocation.
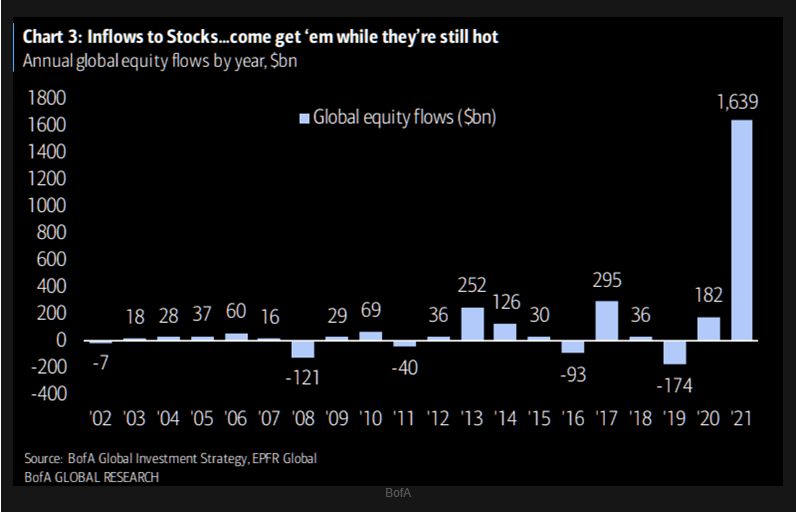
Fig #3 – Global Equity Flows – Source: Bank of America
Fund Manager Survey
The latest Fund Manager Survey from Bank of America reveals that 91% per cent of FM’s expect a stronger economy for the remainder of this year. This is the highest figure EVER! – see fig #4. If that isn’t a bearish contrarian signal, then what is?
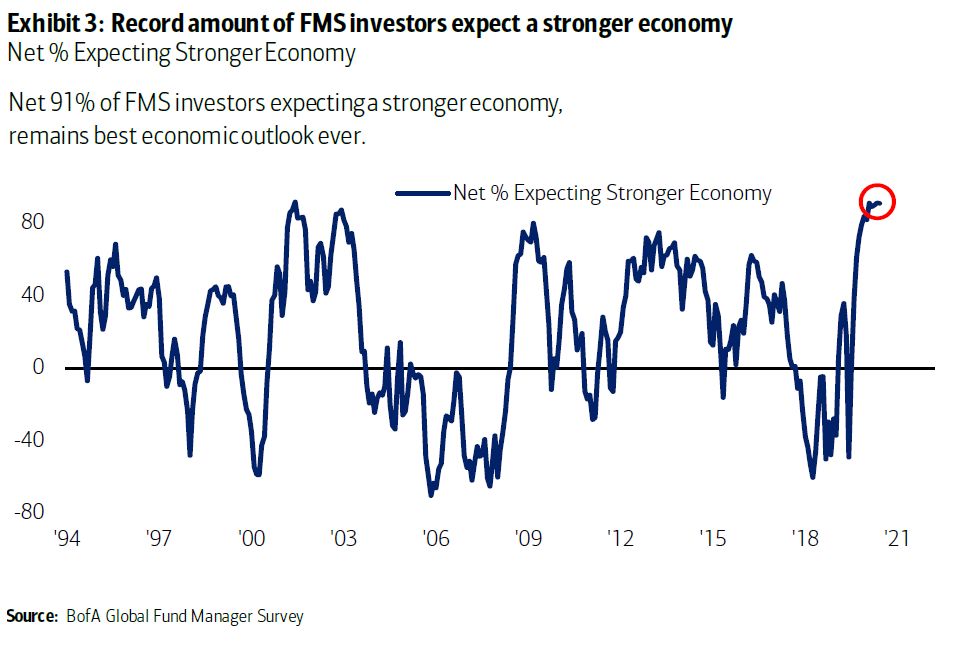
Fig #4 – Economic Outlook – Source: Bank of America
MSCI Emerging Markets
One of the benchmark illustrations of the Elliott Wave a-b-c zig zag advances from last year’s low is shown in the MSCI Emerging Market index – see fig #5. Note how wave a.’s high at 1129.00 x 61.8% equals the terminal high of wave c. at 1449.00. This ‘proofs’ its completion as the 1st wave within the larger degree ending/contracting-diagonal pattern. The final pattern of the secular-bull uptrend.
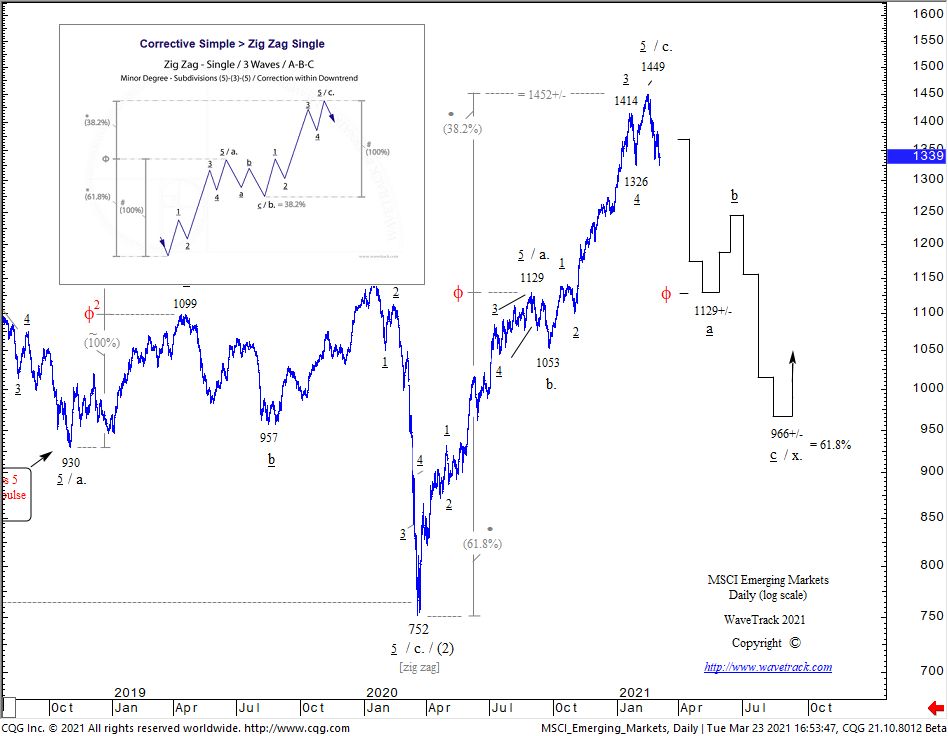
Fig #5 – MSCI Emerging Markets – Daily – WaveTrack International
A huge 2nd wave correction is about to get underway. Ordinarily, 2nd wave corrections within contracting-type diagonals retrace the 1st wave by fib. 76.4% per cent. But in our example, we’ve been more conservative showing the fib. 61.8% ret. level at 966.00+/-. But that’s still a decline of -33% per cent!
And recently, we’ve seen huge inflows into Emerging Markets. See Bank of America’s FMS survey results which show emerging markets are expected to be the No.1 outperformance asset class compared to the S&P 500, Crude Oil, Gold, U.S. Housing, Bitcoin and US30yr treasuries see fig #6.
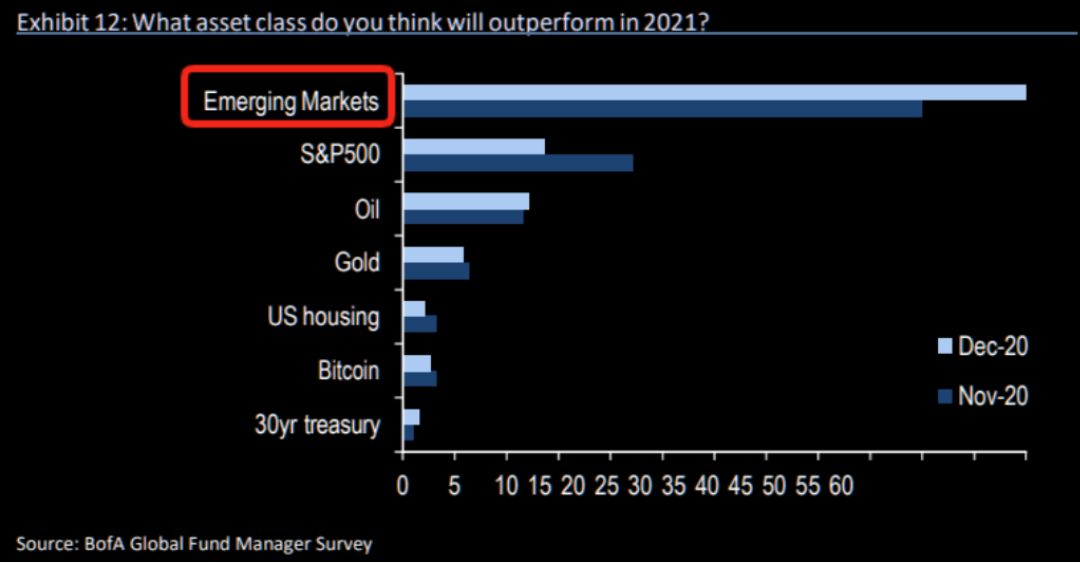
Fig #6 – Asset Class Outperformance – Bank of America
The MSCI EM’s diagonal pattern has been well documented in our Elliott Wave analysis for a number of years. Here’s an update of what it looks like today – see fig #7.
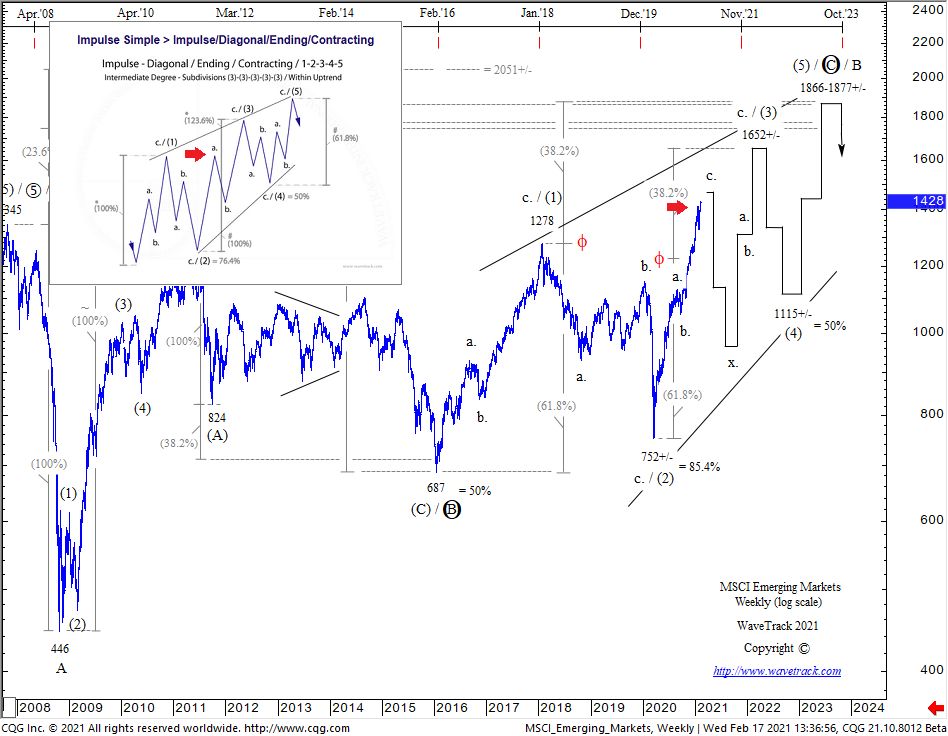
Fig #7 – MSCI Emerging Markets – Weekly by WaveTrack International
March ’20 Zig Zag Advances Completing 1st Wave Uptrends – read more in WaveTrack Elliott Wave Navigator report!

Recent Posts
Recent Comments
Archives
- April 2024
- February 2024
- January 2024
- December 2023
- August 2023
- July 2023
- June 2023
- March 2023
- February 2023
- January 2023
- December 2022
- November 2022
- October 2022
- August 2022
- July 2022
- June 2022
- May 2022
- March 2022
- February 2022
- January 2022
- December 2021
- August 2021
- July 2021
- June 2021
- March 2021
- February 2021
- January 2021
- December 2020
- November 2020
- August 2020
- July 2020
- June 2020
- May 2020
- April 2020
- March 2020
- February 2020
- January 2020
- December 2019
- October 2019
- September 2019
- July 2019
- June 2019
- May 2019
- April 2019
- March 2019
- February 2019
- January 2019
- December 2018
- November 2018
- September 2018
- August 2018
- July 2018
- June 2018
- May 2018
- April 2018
- March 2018
- February 2018
- January 2018
- December 2017
- November 2017
- October 2017
- September 2017
- August 2017
- July 2017
- June 2017
- May 2017
- March 2017
- February 2017
- January 2017
- December 2016
- November 2016
- October 2016
- September 2016
- August 2016
- July 2016
- June 2016
- May 2016
- April 2016
- March 2016
- February 2016
- January 2016
- December 2015
- November 2015
- October 2015
- September 2015
- August 2015
- July 2015
- June 2015
- May 2015
- April 2015
- March 2015
- February 2015
- January 2015
- December 2014
- November 2014
- October 2014
- September 2014
- August 2014
- July 2014
- June 2014
- May 2014
- April 2014
- March 2014
- February 2014
- January 2014
- December 2013
- November 2013
- October 2013
- September 2013
- August 2013
- July 2013
- June 2013
- May 2013
- April 2013
- March 2013
- February 2013
- January 2013
- December 2012
- November 2012
- October 2012
- September 2012
- August 2012
Categories
- ADXY Index
- Agnico Eagle Mines
- Alcoa
- Amazon
- AngloGold Ashanti
- APPL
- Apple
- ASX 200
- AUD vs USD
- AUDNZD
- AUDUSD
- Australia ASX 200
- Baltic Dry Index
- Banking
- Base Metals
- Biotechnology
- Bitcoin
- Bovespa
- Catalexit
- central banks
- Christmas
- Commodities
- Commodities Video Outlook 2020
- Conference
- Copper
- Coronavirus Sell-Off
- CRB
- Crude oil
- crude oil price chart
- CryptoCurrency
- Currencies
- Cycles
- Dax 30
- deutsche bank
- Dewey Cycle
- DJ Transportation Average
- DJ Utilities
- Dow Jones 30
- Dow Theory
- ECB
- economy
- Elliott Wave
- Elliott Wave Charts
- Elliott Wave Patterns
- Elliott Wave Principle
- Emerging Markets
- Ending-Diagonal Elliott Wave Pattern
- Equity
- EUR vs CHF
- EUR/USD
- Euro / US$
- Eurostoxx 50
- EuroStoxx50
- EuroStoxxBanks
- EURUSD
- Expanding Flat Pattern
- FAAMG
- FANG+
- fib-price-ratio
- Fibonacci Trading
- Fibonacci-Price-Ratio
- Financial Forecasting
- Fixed Income
- forex
- FTSE 100
- Fund Management
- FX
- FXStreet
- GBP/AUD
- GBP/USD
- GDX
- GDXJ
- Germany 10 year Euro Bund future
- Gilead Sciences
- Global Economy
- Gold
- Gold Mining
- Golden Ratio
- goldman sachs
- Google Inc.
- Greek debt crisis
- Hang Seng
- Harbinger
- Hungarian Forint
- IBEX 35 Index Spain
- Independent Research
- India-CNX Nifty 50
- Interest Rates
- Interview
- IRP Independent Research
- kbw bank index
- Lonmin
- McDonald's
- MID-YEAR VIDEO UPDATE!
- Mifid II
- Mines
- Mining
- MSCI China
- MSCI Emerging Markets
- Nasdaq 100
- Nasdaq Biotechnology Index
- Nasdaq Composite
- Nasdaq100
- Nikkei 225
- NYSE Composite Index
- Palladium
- Platinum
- Precious Metals
- Ralph Nelson Elliott
- Reversal-Signature
- Russell 2000
- Russia RTS
- S&P 500
- Sector
- Secular-Bull
- Sentiment Survey
- Shanghai Composite Index
- Silver
- Slanting Flat Elliott Wave Pattern
- SP100
- SP400 Mid-Cap
- SP500
- SPX 500
- STLG/AUD
- Stlg/US$
- STLG/USD
- STLG/YEN
- STLG/ZAR
- Stock Index
- Stock Index Tracking
- Stock Index Video
- Stock Indices
- Stock Indices Video Outlook 2023
- Sugar
- Summary
- Tesla Inc
- Toyota
- Track Record
- trading
- Trusts
- Tutorial
- Uncategorized
- UniCredit
- US
- US Dollar Index (DXY) (USDX)
- US$ Index
- US-Dollar Index
- US10yrYields
- USD
- USD/ARS
- USD/CNY
- USD/IDR
- USD/INR
- USD/MXN
- USD/SGD
- USD/THB
- USD/YEN
- USD/ZAR
- Value Line Index
- video
- VIDEO OUTLOOK 2018
- VIDEO OUTLOOK 2020
- VIX
- W.D. Gann
- WaveTrack International
- XAU Gold/Silver Index
- Xetra Dax
- XOP
- Yields
- Zig Zag
- Zinc
- ‘INFLATION-POP’
- ‘SHOCK-POP-DROP’
