SP500 and 3 Degrees of Trend
by WaveTrack International| February 26, 2019 | 2 Comments
SP500 – Three Degrees of Trend Ends December’s Impulse Upswing @ 2814.00
It’s important to verify pattern completion using Fib-Price-Ratios. Markets tend to unfold into repeating, sequentially ordered patterns but they’re also governed by specific amplitude measurements that can be measured applying the Fibonacci ratio series.
December’s broader five wave upswing of the SP500 is a good example of how the combination of structural Elliott Wave patterning combines with fib-price-ratios in order to depict a terminal higher reached last night (Monday, January 25th) at 2814.00. Three degrees of trend are visible in this advance, minuette, sub-minuette and micro – the last two define the subdivision of the fifth wave.
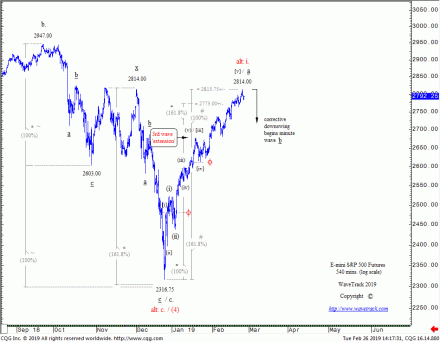
SP500 and 3rd wave extension – minuette degree
The broader five wave upswing from 2316.75 (futures) is labelled in minuette degree, [i]-[ii]-[iii]-[iv]-[v] – see fig #1.

E-mini SP500 Futures – 540 mins. – 3rd wave extension – minuette degree and Fibonacci Price measurement
Extending waves [i]-[iv] by a fib. 61.8% ratio projects a terminal high for wave [v] to 2813.75+/-. This is a commonly recurring fib-price-ratio which is more reliable than others. Note that wave [iii] is the ‘extended’ wave, i.e. is larger than waves [i] and [v].
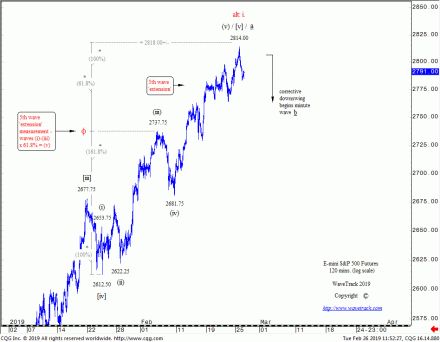
SP500 and 5th wave extension – sub-minuette degree
Minuette wave [v] began its advance from the January 23rd low of 2612.50 – see fig #2. Subdividing into sub-minuette degree, (i)-(ii)-(iii)-(iv)-(v), note how wave (v) which began lifting higher from the February 8th low of 2681.75 has undergone an ‘extension’, i.e. has unfolded larger than waves (i) and (iii). This is a very unusual event, something like a 7/100 probability. Ordinarily, this advance would have ended earlier at the Feb. 14th high of 2763.00 but the ‘extension’ has prolonged December’s uptrend.

E-mini SP500 Futures – 120 mins. – 5th wave extension – sub-minuette degree and Fibonacci Price measurement
Using fib-price-ratios to verify its completion, sub-minuette waves (i)-(iii) are extended by a fib. 61.8% ratio which projects a terminal high for wave (v) to 2818.00+/-. Close enough! This specific fib-price-ratio measurement is only used for 5th wave extensions!
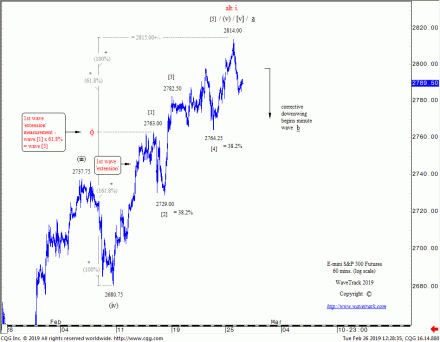
SP500 and 1st wave extension – micro degree
When sub-minuette wave (v) began its final advance from the February 8th low of 2680.75, it unfolded into a five wave subdivision ending at 2763.00 on Feb. 14th – see fig #3.
This would have ordinarily ended wave (v), in turn, terminating December’s uptrend. But it instead underwent a corrective downswing to 2729.00 then resumed higher. This action created a 1st wave extension within wave (v), subdividing in micro degree, [1]-[2]-[3]-[4]-[5] where 2763.00 became wave [1] and 2729.00 wave [2]. This was followed by waves [3]-[4]-[5] – note how wave [1] becomes the ‘extended’ wave, i.e. is larger than either waves [3] or [5]. And even more interesting, if wave [1] is extended by a fib. 61.8% ratio, it projects a terminal high for wave [5] to 2815.00+/-. Again, close enough! This specific fib-price-ratio measurement is only used for 1st wave extensions!
Conclusion
When a wave sequence other than a 3rd wave undergoes ‘extension’ or ‘price-expansion’, as a 1st or 5th wave, they can become more difficult in predicting the end of the larger impulse pattern. This was especially the case where the SP500’s sub-minuette wave (v) five underwent ‘extension’ – but given the focus and dedication needed, also the knowledge and use of Fib-Price-Ratio techniques, then yes, it is possible to see how the phi 61.8% ‘golden-ratio’ can reveal the market’s symmetry for highlighting terminal trends.
Find out what WaveTrack’s latest SP500 forecast is subscribe to the EW-Compass report.


