S&P 500 weekly
by m.tamosauskas| September 3, 2014 | No Comments
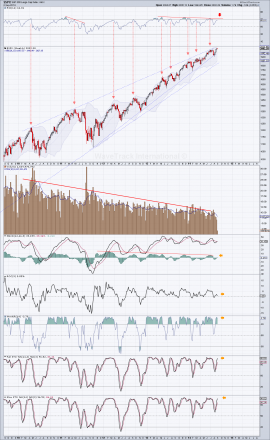
The long-term momentum study of S&P 500 index shows deteriorating market internals in almost all over the place. The highest RSI reading was recorded last year in May and since when it is diverging with a rising S&P 500 index. To keep this diverging pace RSI must stay below 72.53 (the last reading peak). Next noticeable thing is a decreasing volume during the entire bull-run. A ten week moving average has been plotted to a better understanding what is going on. Lesser and lesser market participation in this game and rules don’t change for an extended period. Finally, the recent S&P 500 pullbacks have become smaller and smaller that produced a wedge shape formation. It is extremely difficult to project the ending point of this pattern but once it’s completed, one can be sure – a swift move down is the highest probability. Basis the projection in our latest EW-Compass reports, the ending point is close and the following decline is expected to be deep. Until it resolves, the trend is up and the only thing you can help yourself is controlling the risk of your portfolio.


