NASDAQ 100 – Success! Downside targets achieved
by WaveTrack International| March 26, 2018 | No Comments
NASDAQ 100 – Downside Targets Achieved @ 6507.84!
Last week’s escalating news-flow around President Trump’s plans to expand upon existing U.S. import tariffs caught the markets out. Subsequently, leading to declines of -9.5% per cent in the Nasdaq 100 over the last 10-day period. Naturally, mass media and analysts continue to debate the impact of a potential trade war. However, the Nasdaq 100 together with the other major U.S. indices is quietly unfolding into some near-perfect Elliott Wave patterns that eliminates all the ‘guessing’ and ‘opinion’ from investors and pundits alike.
Expanding Flat Pattern
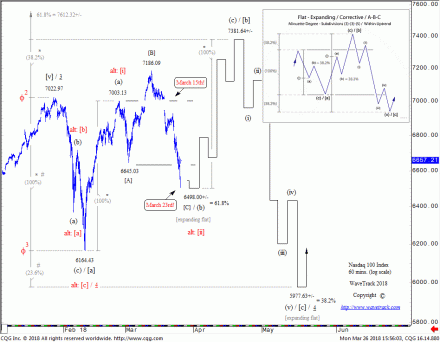
January’s decline hasn’t finished yet! It’s identified as unfolding into an Elliott Wave expanding flat pattern – see tutorial graphic, top-right – fig #1. There are quite a few twists and turns in this pattern particularly in the second sequence. This means we have to expect a lot more price volatility over the coming month.
The expanding flat is composed of three main price-swings. These price swings are labelled in minuette degree as waves [a]-b]-[c]. Each of them subdividing 3-3-5 or otherwise termed as zig zag-zig zag-impulse patterns. Wave [a] establishes the initial price-extremity of the pattern. Wave [a] did this by declining from January’s high of 7022.97 into a zig zag, ending in mid-February at 6164.43. Now, waves [b] and [c] must then marginally break beyond wave [a]’s trading-range in order to complete the expanding flat. The amplitudes of waves [b] and [c] can be measured using fib-price-ratios.
First of all, the 2nd sequence of the expanding flat, wave [b] is unfolding higher from the mid-February low of 6164.43 as a zig zag pattern, labelled (a)-(b)-(c). Wave (b) was recently forecast as unfolding into an expanding flat pattern, labelled [A]-[B]-[C] with downside targets towards 6498.00+/-. Also, last week’s dramatic sell-off basis the Trump tariff news pulled prices directly into this downside area ending into Friday’s session low at 6507.84. This is less than ten points from objectives – Monday’s (today’s) opening has rejected this low, trading now at 6657.21. This ends wave (b) of February’s zig zag upswing – wave (c) is now en-route towards 7381.64+/-.
Trade Negotiations or Trade War?
US Treasury Secretary Steve Mnuchin said yesterday this about China – ‘We’re having very productive conversations with them. I’m cautiously hopeful we reach an agreement’. China’s Ministry of Foreign Affairs replied by saying ‘China is willing to negotiate to appropriately manage and control differences with the United States on the basis of mutual respect and mutual benefit’.
Conclusion
Basis the expanding flat, a short-term reprieve around tariff talks has softened last week’s sell-off. Hence today’s stock market pull away from last Friday’s lows. But if the expanding flat has another sharp decline coming once current prices trade to higher-highs, then for sure, we can expect the talks to break down – unless another exogenous event takes its place!
Are you trading Nasdaq 100, Russell 2000, Dow Jones 30, EuroStoxx, Dax, FTSE100, Shanghai Composite, Hang Seng or ASX200? Don’t miss WaveTrack’s regular updates in our bi-weekly EW-Compass Report! Ensure you’re tracking our Forex forecasts – subscribe online for the EW-COMPASS REPORT.
Visit us @ www.wavetrack.com and subsribe to our latest EW-COMPASS report!


